
Market Segmentation: Turning a Broad Market Into a Winnable Plan
A market is only useful to a go to market team once it has been broken down into pieces small enough to actually act on. Market segmentation takes a broad, undifferentiated pool of potential customers and organizes it into groups that share similar needs, buying behavior, and willingness to pay. Without this step, sales and marketing end up chasing every lead that comes in the door, spreading budget thin across buyers who need very different things and respond to very different messages.
This guide covers the full scope of market segmentation inside a go to market program, starting with the overall approach, moving through sizing and classification, building out ideal customer profiles and buyer personas, and finishing with a prioritized list of segments worth pursuing first.
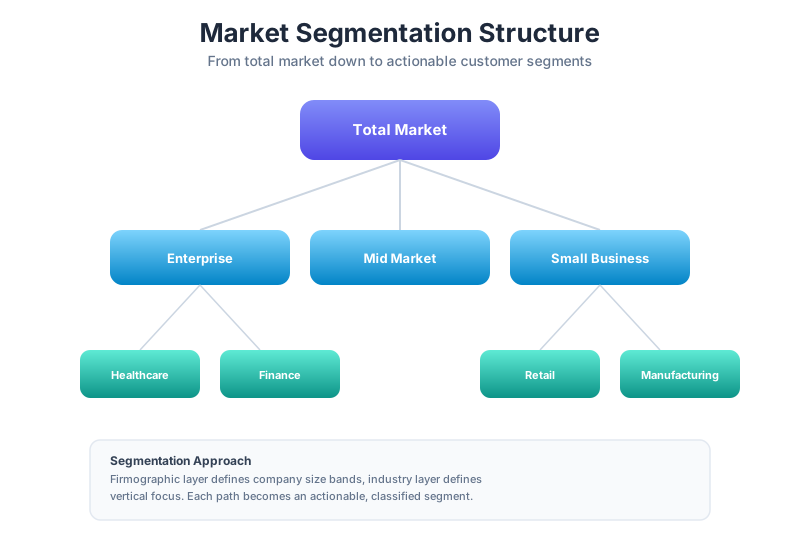
Market Segmentation Overview
Before a team can segment a market well, it needs to agree on why segmentation matters and how it will be done. Skipping this groundwork often leads to segments that look tidy on a slide but do not actually change how sales or marketing operate day to day.
Segmentation Approach
There is more than one way to slice a market, and the right approach depends heavily on what a company sells and how buyers make decisions. Common segmentation approaches include:
- Needs based segmentation, grouping customers by the problem they are trying to solve
- Firmographic segmentation, grouping by company size, industry, or revenue
- Behavioral segmentation, grouping by how customers currently buy or use similar products
- Value based segmentation, grouping by how much a customer is willing to pay for a solution
Most mature go to market teams end up blending two or three of these approaches rather than relying on a single lens, since firmographics alone rarely explain why one company buys eagerly while an almost identical company on paper does not.
The right blend usually depends on how commoditized the buying decision already is within a category. In more mature categories, where most buyers already understand the problem and are comparing specific vendors, needs based and behavioral segmentation tend to explain purchasing patterns more accurately than firmographics alone. In newer or less understood categories, firmographic segmentation often serves as a useful starting point simply because there is not yet enough behavioral data available to build a more nuanced model.
It is also worth revisiting the segmentation approach itself periodically, rather than assuming the framework chosen at launch will remain the right one forever. As a company matures and collects more data on how different types of customers actually behave, a purely firmographic approach chosen early on often gives way to a more sophisticated blended model that better reflects real buying patterns observed in closed and lost deal data.
Market Structure
Understanding market structure means mapping how the overall market breaks down before segmentation even begins, including how many distinct buyer types exist, how concentrated demand is among a small number of large accounts versus spread across many smaller ones, and how much overlap exists between segments. A market with a small number of very large accounts calls for a different go to market motion than a market made up of thousands of small, similar sized buyers.
Markets dominated by a small number of large accounts, sometimes called concentrated demand markets, often justify an account based approach where sales and marketing coordinate closely around a named list of target companies. Markets with demand spread widely across many smaller buyers, by contrast, tend to favor a more scalable, product led or inside sales motion, since the economics of dedicating a full account team to each individual buyer simply do not work at that scale. Getting this structural read right early prevents a company from building an expensive, high touch sales motion for a market that actually needs a lighter, more automated approach, or the reverse mistake of under investing in a market that genuinely requires white glove account management to win.
Segment Classification
Once a segmentation approach is chosen, each segment needs a clear, consistent classification system so that sales, marketing, and product teams are all speaking the same language when they refer to a given segment. A shared classification system prevents the common problem where marketing defines a segment one way, sales defines it another way, and reporting ends up impossible to reconcile across teams.
| Classification Dimension | Example Categories | Why It Matters |
|---|---|---|
| Company Size | Small business, mid market, enterprise | Impacts deal size, sales motion, and support needs |
| Industry Vertical | Healthcare, finance, retail, manufacturing | Impacts compliance requirements and messaging |
| Buying Maturity | Early adopter, mainstream, laggard | Impacts education needs and sales cycle length |
| Purchase Behavior | Self serve, sales assisted, procurement led | Impacts channel strategy and pricing model |
Consistency matters more than perfection when it comes to classification. A slightly imperfect but universally adopted classification system will outperform a theoretically ideal system that only the marketing team understands and uses, since the real value comes from every team pulling reports and making decisions using the same shared definitions. Documenting the classification system in a place every team can reference, and revisiting it during quarterly planning, keeps everyone aligned as the business grows and new edge cases inevitably appear.
Segmentation Objectives
Segmentation is not an academic exercise, it exists to drive specific business decisions. Clear objectives might include identifying which segments deserve dedicated sales coverage, which segments should be served through self serve or product led channels, and which segments are not worth pursuing at all given current resources. Writing these objectives down before segmentation work begins keeps the whole exercise anchored to decisions the business actually needs to make.
A useful test for any segmentation objective is asking what specific action would change based on the answer. If a proposed segmentation dimension would not actually change how a sales rep prioritizes their pipeline, how marketing allocates budget, or how product prioritizes its roadmap, it is probably not worth the effort to build out in detail. Keeping the objectives concrete and action oriented prevents segmentation projects from becoming an interesting academic exercise that produces a beautiful slide deck nobody actually uses to make decisions.
Total Addressable Customer Base
With a segmentation approach in place, the next step is understanding exactly how many customers exist across the market and how they are distributed.
Customer Universe
The customer universe represents the full count of potential buying entities across the market, whether that is companies, business units within larger companies, or individual consumers depending on what is being sold. Building this number requires pulling from business directories, industry databases, and government registration data, then applying filters based on the criteria that matter most, such as company size, industry, or geography.
It helps to treat the customer universe as a living dataset rather than a number calculated once and never revisited. Business directories and firmographic databases are updated regularly, new companies form, others close or get acquired, and industry classification codes occasionally get restructured in ways that shift how many companies fall into a given category. Refreshing the underlying customer universe data at least annually keeps segment sizing grounded in current reality rather than a snapshot that quietly grows stale as the market itself continues to shift underneath it.
Segment Sizing
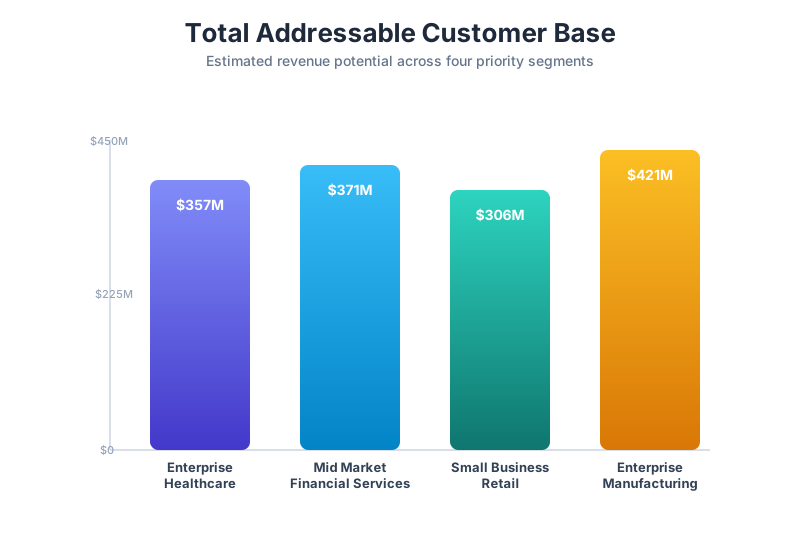
Once the customer universe is established, each segment within it needs its own size estimate, both in terms of number of potential buyers and total revenue opportunity. Segment sizing should use the same TAM, SAM, SOM discipline covered in market research, applied at a more granular level within each individual segment rather than only at the overall market level.
| Segment | Estimated Buyer Count | Average Deal Size | Segment Revenue Potential |
|---|---|---|---|
| Enterprise Healthcare | 4,200 | $85,000 | $357M |
| Mid Market Financial Services | 11,600 | $32,000 | $371M |
| Small Business Retail | 68,000 | $4,500 | $306M |
| Enterprise Manufacturing | 6,900 | $61,000 | $421M |
Segment sizing works best when it is cross checked against actual pipeline and closed deal data rather than relying purely on external market data. If external estimates suggest a segment should be far larger than what sales is actually seeing come through the pipeline, that gap is worth investigating, since it could point to either an accessibility problem worth solving or a sign that the external data is overstating true demand. Over time, blending bottom up sizing built from internal deal data with top down estimates pulled from industry sources produces a far more trustworthy number than either approach used alone.
Market Penetration
Market penetration measures how much of a given segment has already adopted a solution in the category, versus how much remains untapped. A segment with low penetration but high awareness of the problem represents a strong opportunity, while a segment with high penetration already locked into competitor contracts requires a very different, more competitive approach to win share.
Penetration data is often easiest to gather through win and loss interviews with prospects, asking directly whether they currently use a similar solution and, if so, which one. Over time, this qualitative data can be aggregated into a rough penetration estimate for each segment, giving the go to market team a clearer sense of which segments still represent green field opportunity versus which ones will require a head on competitive displacement strategy to win meaningful share.
Customer Distribution
Customer distribution looks at how buyers within a segment are actually spread out, whether concentrated in a handful of major metro areas, clustered around specific industry hubs, or evenly distributed across a broader geography. This distribution directly informs event strategy, regional sales hiring, and localized marketing investment.
A segment heavily concentrated around a small number of industry hubs, for example, often responds well to a focused local event and community strategy, since word of mouth travels quickly within a tight geographic or professional cluster. A more evenly distributed segment, by contrast, usually requires a broader digital marketing strategy since no single local presence will reach a meaningful share of the total addressable buyers.
Growth Potential
Beyond the current size of a segment, growth potential considers how quickly that segment is expected to expand over the coming years, based on industry growth rates, new company formation, and broader economic trends specific to that vertical or buyer type. A smaller segment growing quickly can be a better long term bet than a larger segment that has already plateaued.
When comparing growth potential across segments, it helps to look several years out rather than judging purely on the current year's momentum, since some segments experience short term spikes driven by temporary factors such as a regulatory change or a one time economic event that will not sustain the same growth rate going forward. A segment showing consistent, multi year growth built on durable underlying demand tends to be a more reliable long term investment than one riding a short lived wave of attention.
Customer Segment Analysis
With sizing established, it helps to dig deeper into what actually distinguishes one segment from another, beyond just headcount and revenue figures.
Industry Verticals
Different industry verticals often have dramatically different buying processes, budget cycles, and regulatory requirements, even when they are purchasing a very similar type of solution. A healthcare buyer and a retail buyer might both need the same core product capability, but the healthcare buyer will move through a slower, more compliance heavy evaluation process while the retail buyer may be ready to purchase within a single call.
Vertical specific budget cycles also deserve attention when planning go to market timing. Many industries follow predictable annual budgeting rhythms, with certain months seeing a surge in new initiative approvals while other months are dominated by renewal and budget planning conversations that leave little room for net new purchases. Aligning outbound campaigns and event timing with these known vertical budget cycles tends to produce noticeably better response rates than running the same campaign calendar uniformly across every industry.
Company Size
Company size remains one of the most reliable predictors of buying behavior across nearly every category. Smaller companies tend to make faster decisions with fewer stakeholders involved, while larger companies bring in procurement, legal, security, and multiple layers of budget approval before a deal closes. Segmenting by company size also helps determine the right sales motion, whether that is self serve, inside sales, or field sales with dedicated account teams.
It is worth noting that company size thresholds are not universal across industries. A one hundred person company in a capital intensive industry such as manufacturing may operate with a budget and organizational complexity closer to a much larger company in a leaner industry such as professional services. Rather than applying a single employee count threshold uniformly across every vertical, more sophisticated segmentation adjusts size bands based on typical revenue per employee and organizational complexity within each specific industry.
Geography
Geographic segmentation captures not just where customers are physically located, but how regional business culture, language preference, and local competitive intensity shape the buying experience. A segment that converts easily in one region may require a completely different approach in another, even when company size and industry look identical on paper.
Beyond broad country level distinctions, regional differences within a single country can matter more than expected, particularly in larger markets where business culture, average deal size, and even preferred communication style can vary meaningfully between major metro areas. Sales teams that recognize these intra country differences, rather than treating an entire country as a single homogenous segment, often see better conversion rates from more tailored regional messaging.
Business Model
The business model a customer operates under, whether subscription based, transaction based, project based, or something else, shapes how they think about return on investment and what pricing structure will resonate with them. A customer running a subscription business, for example, often responds well to a vendor offering a similarly predictable, recurring pricing model rather than a large upfront cost.
Understanding a prospect's own business model also helps predict how they will evaluate risk. A project based business, accustomed to variable costs tied to specific client engagements, may be far more comfortable with usage based pricing than a subscription business used to predictable, fixed monthly costs. Matching pricing structure to a customer's own business model removes friction that has nothing to do with the actual value of the product being sold.
Organizational Maturity
Organizational maturity refers to how sophisticated a customer's internal processes and tooling already are. A highly mature organization with dedicated operations teams and existing tool stacks will evaluate a new purchase very differently than a less mature organization still running critical processes through spreadsheets and manual workflows. Messaging and onboarding both need to flex based on where a given segment sits on this maturity spectrum.
Less mature organizations often need more hand holding during onboarding and may take longer to see full value from a new tool, simply because they lack the surrounding processes and internal expertise that more mature organizations already have in place. Building a distinct onboarding path for less mature customers, rather than applying the same fast paced implementation plan used for sophisticated buyers, tends to improve both adoption rates and long term retention within this part of the market.
Ideal Customer Profile (ICP)
Once segments are understood in depth, the next step is defining exactly which type of customer represents the best possible fit, both for the customer and for the business.
Primary ICP
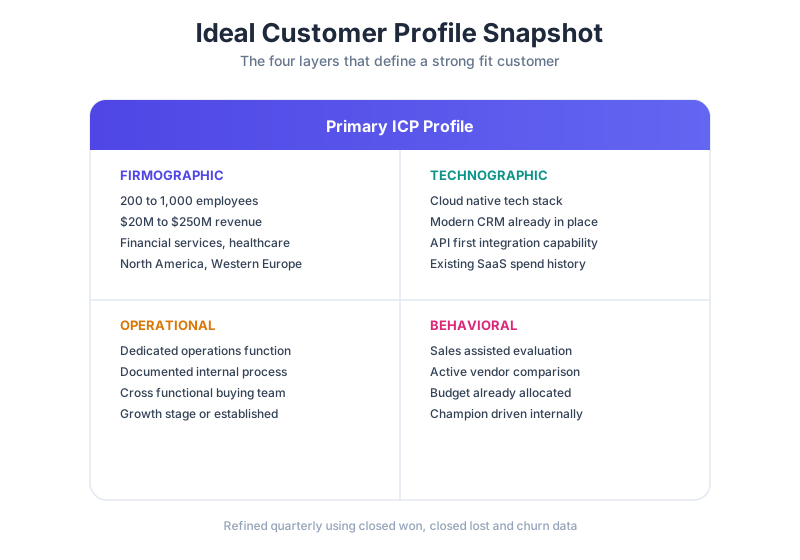
The primary ICP describes the single most important customer profile a go to market team should build its entire motion around. This profile should be specific enough that a sales rep could look at a company's website and immediately know whether it qualifies, rather than a vague description that could technically apply to half the market.
Building the primary ICP well requires looking closely at existing best customers, meaning those with high satisfaction scores, low churn, and strong expansion revenue over time, rather than simply looking at the largest customers by initial deal size. A large customer that churns within a year teaches a very different lesson than a smaller customer that renews enthusiastically and expands every year, and the ICP should be built around the pattern of the latter rather than chasing the size of the former.
Secondary ICP
A secondary ICP captures a second, slightly different profile worth pursuing, often representing an adjacent segment with strong potential but somewhat different needs or buying behavior than the primary profile. Keeping the secondary ICP clearly distinct from the primary prevents sales teams from treating every lead the same way regardless of fit.
A useful discipline is limiting the organization to just one primary and one secondary ICP at any given time, resisting the temptation to define five or six ICPs that end up covering nearly the entire addressable market. The whole value of an ICP comes from its specificity, and an organization trying to serve too many ideal profiles at once often ends up with messaging so broad it fails to resonate deeply with any of them.
Firmographic Profile
A firmographic profile lays out the specific company level attributes that define a strong fit, including:
- Company size, measured by employee count or annual revenue
- Industry vertical and sub vertical
- Geographic location and regional presence
- Growth stage, such as early stage, growth stage, or established
These attributes work best when validated against actual closed won data rather than assumed based on who the sales team feels most comfortable selling to. Running a simple analysis comparing firmographic attributes across won deals, lost deals, and churned customers often reveals patterns that differ from the informal ICP the team has been carrying around in their heads, and those data backed adjustments tend to meaningfully improve targeting accuracy going forward.
| ICP Dimension | Primary ICP | Secondary ICP |
|---|---|---|
| Company Size | 200 to 1,000 employees | 50 to 200 employees |
| Industry | Financial services, healthcare | Professional services, retail |
| Revenue | $20M to $250M annual revenue | $5M to $20M annual revenue |
| Geography | North America, Western Europe | Broader English speaking markets |
Technographic Profile
A technographic profile identifies the specific tools and technology stack a strong fit customer is likely already using, since existing tooling often signals both budget availability and integration compatibility. A customer already using a modern cloud based tech stack, for example, is usually an easier sell than one still running on legacy on premise systems that will require significant migration work.
Technographic data has become increasingly accessible through third party providers that scan public job postings, website code, and vendor integration marketplaces to infer what tools a company already uses. Layering this data on top of firmographic filters allows sales development teams to prioritize outreach toward companies that are technically ready to adopt a new solution today, rather than spending time on prospects who would first need to modernize significant parts of their existing infrastructure.
Operational Characteristics
Beyond firmographics and technographics, operational characteristics describe how an ideal customer actually runs their day to day business, such as team structure, existing process maturity, and the specific operational pain points that make them a strong candidate for the solution being sold. These characteristics often come from direct interviews with the best existing customers, since they are harder to find in third party data sources than firmographic or technographic details.
Capturing operational characteristics usually requires a more qualitative research process, such as structured interviews or win and loss analysis conversations, rather than pulling from a database. While more time consuming to gather, this layer of the ICP often explains the deeper why behind purchasing decisions in a way that firmographic and technographic data alone cannot fully capture.
Buyer Personas & Decision Makers
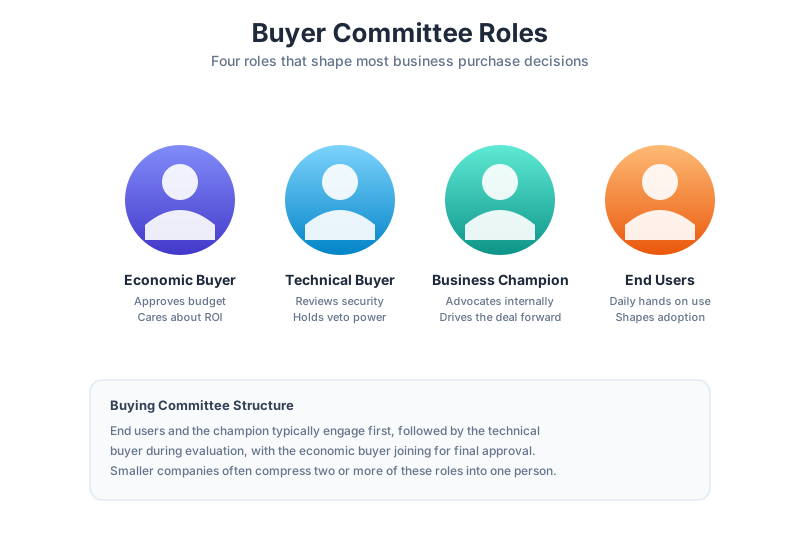
Even within a strong ICP, no single person makes a purchase decision alone. Understanding the different roles involved in a buying decision is critical to building sales and marketing content that actually moves a deal forward.
Economic Buyer
The economic buyer holds the budget and ultimate authority to approve a purchase. This person usually cares most about return on investment, risk reduction, and how a purchase decision reflects on their broader department or company goals. Messaging aimed at the economic buyer should focus on business outcomes rather than product features.
Economic buyers often enter a deal later in the process than other buyer roles, sometimes only appearing for a final approval conversation after the champion and technical buyer have already done most of the evaluation work. Preparing the champion with the right business case materials to bring into that final conversation, even when a sales rep may never speak with the economic buyer directly, is often more important than trying to reach that person early in the sales process.
Technical Buyer
The technical buyer evaluates whether a solution meets specific technical requirements, such as security standards, integration capability, and scalability. This person often has veto power even when they are not the ultimate budget holder, since a failed technical review can stall or kill a deal that otherwise looked strong.
Engaging the technical buyer early, rather than waiting until late stage security review, tends to prevent unpleasant surprises that can derail an otherwise strong deal. Providing clear, accessible technical documentation upfront, rather than making the technical buyer request it repeatedly through a sales rep, signals both respect for their role and confidence in the product's technical readiness.
Business Champion
The business champion is the internal advocate who wants the solution to succeed and actively pushes the deal forward internally, often because they are the one dealing with the pain point the solution addresses on a daily basis. Equipping the champion with the right materials to sell internally, even when a sales rep is not in the room, often determines whether a deal closes or stalls.
A strong champion relationship is often the single best predictor of deal success across an entire buying committee. Sales teams that invest time understanding what the champion personally needs to look good internally, beyond just closing the deal, tend to build stronger, more durable champion relationships that also pay off during renewal and expansion conversations long after the initial sale.
End Users
End users are the people who will actually use the product day to day once it is purchased. Their feedback during evaluation, whether from a trial, pilot, or demo, often carries significant weight with both the champion and the economic buyer, particularly in bottoms up or product led sales motions where user adoption drives the eventual purchase decision.
In product led or freemium motions especially, end users effectively become the earliest and most influential evaluators in the entire buying process, since their day to day experience during a free trial often determines whether the opportunity to reach an economic buyer ever materializes at all. Investing heavily in the end user onboarding experience pays dividends across the entire funnel in these types of go to market motions.
| Buyer Role | Primary Concern | Content That Resonates |
|---|---|---|
| Economic Buyer | Return on investment, risk | Business case studies, ROI calculators |
| Technical Buyer | Security, integration, scalability | Technical documentation, architecture diagrams |
| Business Champion | Internal credibility, ease of advocacy | Internal pitch decks, comparison sheets |
| End Users | Day to day usability | Product demos, trial access |
Buying Committee Structure
The buying committee structure maps how these different roles interact throughout the purchase process, including who needs to sign off at each stage and in what order. Larger organizations often have more formal, sequential committee structures, while smaller organizations may compress several of these roles into a single decision maker who wears multiple hats.
Mapping the buying committee structure for a specific target segment, rather than assuming the same structure applies everywhere, helps sales teams plan their engagement strategy more effectively. A segment where the same person typically acts as both economic and technical buyer requires a very different sales approach than a segment where those roles are always split across two or three separate people who rarely speak with the vendor directly at the same time.
Customer Needs & Buying Drivers
Understanding who is involved in a purchase decision is only half the picture. The other half is understanding what actually drives that decision in the first place.
Business Objectives
Every purchase ultimately ties back to a broader business objective, whether that is reducing operational costs, increasing revenue, improving customer satisfaction, or meeting a compliance requirement. Anchoring sales and marketing messaging to these underlying objectives, rather than product features alone, tends to resonate far more strongly across every buyer role involved in the decision.
Different buyer roles often care about different business objectives even within the same deal, which is why a single piece of messaging rarely works equally well across an entire buying committee. A finance stakeholder may care most about cost reduction, while an operations stakeholder cares more about efficiency gains, even though both are evaluating the exact same purchase decision.
Pain Points
Pain points represent the specific, often frustrating problems a customer experiences today that a new solution promises to fix. The strongest go to market messaging speaks directly to these pain points in language customers already use themselves, rather than translating them into internal product terminology that does not match how the customer actually describes their own frustration.
Gathering authentic pain point language directly from sales call recordings, support tickets, and customer interviews tends to produce far more resonant messaging than language generated internally by a marketing team working from assumptions. Customers often use surprisingly specific, colorful language to describe their frustrations, and borrowing that exact language in outward facing messaging creates an immediate sense of being understood that generic product marketing language rarely achieves.
Purchase Motivations
Purchase motivations go beyond pain points to capture the emotional and strategic reasons a buyer decides now is the time to act, whether that is a new leader pushing for change, a competitive threat forcing modernization, or simply having finally secured budget after months of trying. Understanding timing motivations helps sales teams recognize when a prospect is genuinely ready to move versus still in early exploration.
A useful habit during discovery calls is asking directly why now, rather than why last year or why not next year. The answer often reveals the true motivation driving urgency, whether that is an external deadline, internal pressure, or a recent negative experience with an existing solution, and understanding this motivation helps a sales rep tailor the rest of the conversation around what will actually move the deal forward rather than a generic feature walkthrough.
Evaluation Criteria
Evaluation criteria are the specific factors a buying committee uses to compare one solution against another, such as price, ease of implementation, security certifications, or customer support quality. Publishing clear, honest information against these criteria, rather than making buyers dig for it, tends to shorten sales cycles considerably.
Building a simple, honest comparison resource that addresses common evaluation criteria head on, including areas where a competitor might genuinely have an edge, tends to build more trust with sophisticated buyers than a comparison page that only ever favors the vendor publishing it. Buyers doing serious due diligence quickly notice when a comparison feels one sided, and that skepticism can spread to other claims made elsewhere in the sales process.
Success Metrics
Success metrics define how a customer will measure whether the purchase actually delivered value after implementation. Understanding these metrics upfront, before a deal even closes, helps account teams set realistic expectations and gives customer success teams a clear target to aim for during onboarding and renewal conversations.
Capturing agreed success metrics in writing during the sales process, rather than leaving them as an informal understanding, gives both the customer and the vendor a clear, shared reference point to revisit at renewal time. This practice also protects the vendor from a customer redefining success after the fact based on a different expectation than what was originally discussed during evaluation.
Segment Attractiveness Assessment
With segments clearly defined, the next step is scoring how attractive each one actually is, since not every segment deserves equal investment.
Market Potential
Market potential looks at the overall size and growth trajectory of a segment, pulling directly from the sizing work done earlier. A larger, faster growing segment naturally scores higher on this dimension than a smaller, slower growing one, though size alone should never be the only factor considered.
Revenue Opportunity
Revenue opportunity translates market potential into a more specific estimate of what a company could realistically capture, accounting for average deal size, expected win rates, and typical customer lifetime value within that segment.
Estimating revenue opportunity well requires being honest about current win rates within a segment rather than assuming an idealized conversion rate. A segment with a large theoretical market potential but a historically low win rate for the specific company doing the evaluation may represent a smaller realistic revenue opportunity than a more modest sized segment where the company already wins consistently.
Accessibility
Accessibility measures how easily a company can actually reach and sell into a given segment, considering factors like existing brand awareness, availability of the right marketing channels, and whether the sales team already has relevant experience selling into that type of buyer.
A segment can look extremely attractive on paper across market potential and revenue opportunity, yet score poorly on accessibility if the company lacks the brand recognition, channel partnerships, or sales expertise needed to actually reach and convert those buyers efficiently. Accessibility should never be treated as a secondary consideration behind the more exciting revenue numbers, since it often determines how quickly, if ever, that theoretical opportunity actually converts into real revenue.
| Segment | Market Potential | Revenue Opportunity | Accessibility | Competitive Intensity |
|---|---|---|---|---|
| Enterprise Healthcare | High | High | Medium | Medium |
| Mid Market Financial Services | High | Medium | High | High |
| Small Business Retail | Medium | Medium | High | Low |
| Enterprise Manufacturing | High | High | Low | Medium |
Competitive Intensity
Competitive intensity evaluates how crowded a given segment already is, including how many established vendors are competing for the same buyers and how entrenched those vendors already are through existing contracts and relationships. A segment with strong potential but extremely high competitive intensity may still be less attractive than a smaller segment with far less competition to fight through.
Strategic Fit
Strategic fit considers how well a segment aligns with a company's broader long term vision, beyond the immediate numbers. A segment might score well on every other dimension but pull the company away from its core strengths or long term positioning, making it a less attractive choice even when the short term revenue opportunity looks appealing.
Weighing strategic fit alongside the more quantitative dimensions helps prevent a company from chasing short term revenue in a segment that ultimately dilutes its brand positioning or spreads engineering resources too thin across unrelated use cases. A segment that scores only moderately on revenue opportunity but strongly reinforces the company's long term category leadership position may deserve more investment than the raw numbers alone would suggest.
Priority Target Segments
Bringing the attractiveness assessment together with practical resourcing constraints produces a clear, tiered list of which segments deserve investment first.
Tier 1 Segments
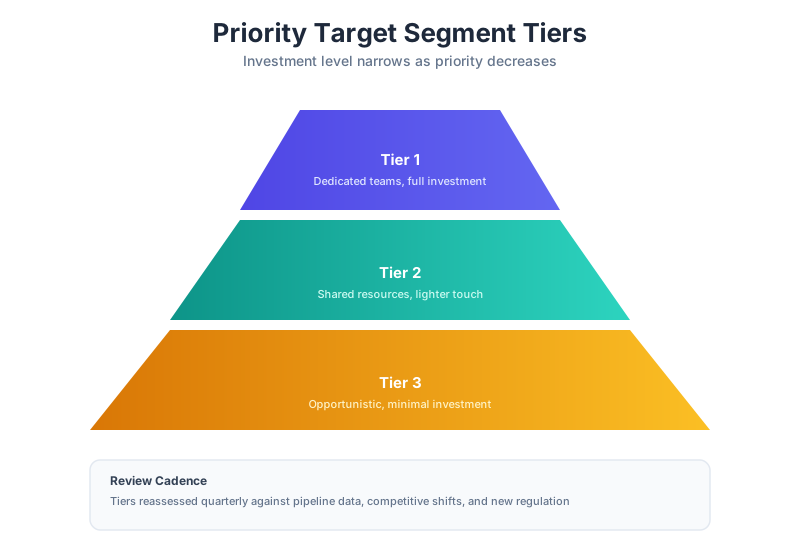
Tier 1 segments represent the highest priority, typically scoring well across market potential, revenue opportunity, and accessibility while facing manageable competitive intensity. These segments should receive the majority of dedicated sales and marketing resources, along with tailored messaging and content built specifically for their needs.
Tier 2 Segments
Tier 2 segments show strong potential but may face higher competitive intensity, lower current accessibility, or a less certain strategic fit. These segments are worth pursuing, often through a lighter touch or more efficient channel such as self serve or partner led sales, rather than the same level of dedicated investment given to tier 1.
Tier 3 Segments
Tier 3 segments represent longer term or opportunistic targets that do not currently justify dedicated investment but should not be ignored entirely. These segments are often worth monitoring for changing conditions, such as new regulation or a shift in competitive dynamics, that could elevate them to a higher tier in the future.
Revisiting the tier assignment for every segment on a regular cadence, rather than treating the tiers as permanent, ensures the go to market motion stays aligned with how conditions are actually evolving. A tier 3 segment that suddenly sees a wave of new demand following a regulatory change, for example, might deserve a swift promotion to tier 2 well before the next scheduled annual planning cycle would otherwise catch that shift.
| Tier | Investment Level | Sales Motion | Example Trigger to Re Evaluate |
|---|---|---|---|
| Tier 1 | Dedicated teams and budget | Field sales, account based marketing | Quarterly performance review |
| Tier 2 | Shared resources, lighter touch | Inside sales, partner channel | Notable shift in accessibility or competition |
| Tier 3 | Opportunistic, minimal investment | Self serve, inbound only | New regulation or market disruption |
Expansion Opportunities
Beyond net new segments, expansion opportunities identify where existing customers within already prioritized segments could be sold additional products, seats, or services. These opportunities often carry lower acquisition cost than net new segment expansion, since the relationship and trust already exist.
Target Account Priorities
For companies using an account based approach, target account priorities translate segment level tiers into a specific, named list of accounts within each tier that sales and marketing should focus on by name, complete with account specific research and tailored outreach plans rather than generic segment level messaging.
Keeping this named account list reasonably sized, rather than trying to cover hundreds of accounts with the same depth of personalization, tends to produce far better results. A shorter, well researched list that sales and marketing can genuinely execute against with tailored outreach usually outperforms a sprawling list that ends up receiving the same generic treatment as every other segment simply because there was not enough time to personalize outreach at that scale.
Segmentation Recommendations
All of this analysis exists to inform a clear set of recommendations that guide where the business actually invests its time and money going forward.
Focus Markets
Focus markets recommendations should clearly state which one or two segments deserve the majority of go to market investment over the coming planning period, along with the reasoning drawn from the attractiveness assessment and tiering work above.
ICP Refinement
As new data comes in from closed deals, lost deals, and customer feedback, the ideal customer profile itself should be refined over time. A recommendations section should include a plan for how often the ICP will be revisited and what data sources will inform those updates, rather than treating the original ICP as fixed forever.
A quarterly ICP review, pulling in the latest closed won, closed lost, and churn data, tends to strike a good balance between staying current and avoiding constant, disruptive changes to targeting criteria that sales and marketing teams need time to actually act on consistently.
Customer Prioritization
Customer prioritization recommendations translate segment tiers into specific guidance for how sales development and account executive teams should allocate their time day to day, ensuring the highest value accounts receive attention first rather than being worked in the order they happen to arrive.
Resource Allocation
Resource allocation recommendations connect segmentation directly to budget and headcount planning, specifying how much of the marketing budget, sales headcount, and product investment should be directed toward each priority tier based on the expected return.
Presenting resource allocation as a simple, proportional breakdown tied directly to the tiering framework, rather than a vague directional statement, gives finance and leadership a much clearer basis for approving budget requests tied to specific segments.
Growth Opportunities
Finally, growth opportunity recommendations highlight where segmentation work has uncovered promising areas for future expansion, whether that is a currently underserved sub segment, a new geography showing strong early signals, or an adjacent buyer persona within an existing segment that has not yet received dedicated attention.
These growth opportunities are worth flagging even when they do not fit neatly into the current tier framework, since some of the most valuable long term bets come from areas the existing segmentation model was not originally built to capture. Keeping a running list of these emerging opportunities, revisited during each planning cycle, ensures promising signals do not get lost simply because they fall outside the current prioritization structure.
Executive Segmentation Summary
The executive summary condenses the full segmentation analysis into a format leadership can review quickly without losing the substance behind the recommendations.
Key Insights
Key insights should highlight the two or three most important discoveries from the segmentation work, stated clearly and backed by the strongest supporting data rather than buried in exhaustive detail better suited to the full report.
Priority Customer Segments
This section presents the ranked list of priority segments in a simple, scannable format, making clear at a glance where the business should focus without requiring leadership to dig through the full tiering analysis to understand the bottom line. A short table or ranked list, rather than dense narrative paragraphs, tends to communicate this information most effectively to a busy executive audience.
Ideal Customer Profile
A condensed version of the ICP, covering only the handful of attributes that matter most for quick reference, gives leadership and new team members a fast way to understand exactly who the business is trying to win without needing to read the full firmographic and technographic breakdown.
Strategic Implications
Strategic implications connect the segmentation findings back to broader company strategy, addressing questions such as whether current product investment aligns with the highest priority segments, or whether the sales team is currently structured in a way that matches where the real opportunity sits.
Recommended Next Steps
The summary should close with a short, concrete list of next steps, whether that is reallocating sales territory assignments to match priority segments, commissioning further research into a promising but underexplored segment, or updating marketing content to speak more directly to the refined ideal customer profile.
Market segmentation, like market research itself, is never a one time exercise. The strongest go to market teams revisit their segmentation regularly, testing assumptions against real deal data and adjusting priorities as the market, competitors, and customer needs continue to shift over time.
Contents