
Measure and Optimize: Turning GTM Activity Into Continuous Improvement
A go to market strategy is only as good as the organization's ability to know whether it is actually working. Measurement and optimization is the discipline of turning scattered activity data, marketing campaigns, sales conversations, customer usage, into a clear, honest picture of performance, and then using that picture to make the strategy genuinely better over time. Without this discipline, teams end up guessing at what is working, repeating ineffective tactics out of habit, and missing real opportunities hiding in data nobody took the time to examine closely.
This guide covers the full scope of measurement and optimization inside a go to market program, starting with overall measurement objectives, moving through performance frameworks, funnel analysis, marketing and sales metrics, and customer performance, and finishing with dashboards, continuous optimization, recommendations, and an executive summary leadership can act on.
Many organizations collect an enormous amount of data without ever building the discipline to genuinely use it. Dashboards multiply, reports pile up, and yet decisions still get made largely on instinct because nobody has taken the time to connect the data being collected to the specific questions the business actually needs answered. The purpose of this guide is to close that gap, building a measurement framework that does not just describe what happened, but actively shapes what the organization does next. Good measurement is not a passive record of the past, it is an active ingredient in a continuous cycle of learning and improvement that compounds in value the longer an organization commits to it.
Measurement & Optimization Overview
Before building specific dashboards or metrics, a team needs a clear, shared understanding of what measurement is meant to accomplish.
Measurement Objectives
Measurement objectives clarify what the measurement effort needs to prioritize, whether that is improving forecast accuracy, identifying the most efficient acquisition channels, or diagnosing why a specific segment underperforms expectations. Being explicit about which objective matters most keeps measurement investment focused on answering the questions that genuinely matter right now, rather than producing an overwhelming volume of data nobody has time to act on.
A company struggling with unpredictable revenue might prioritize better pipeline visibility and forecasting metrics, while a company uncertain about channel efficiency might prioritize clearer attribution and channel level performance data instead. Naming the specific decision measurement needs to support keeps the resulting framework practical rather than an exhaustive collection of metrics assembled without clear purpose.
Revisiting measurement objectives periodically matters as well, since the questions a business most needs answered naturally shift as it grows, moves into new markets, or faces new competitive pressure that earlier measurement priorities may not have anticipated.
A useful exercise here is periodically asking each functional leader what single question, if answered confidently with data, would most change how they operate day to day. The answers often reveal gaps in the current measurement framework that would otherwise go unnoticed until a much more consequential decision is already being made without adequate supporting data.
GTM Success Framework
A GTM success framework defines what winning actually looks like across the full go to market motion, connecting individual metrics back to a coherent overall picture of health rather than leaving each function to define success independently using disconnected, sometimes contradictory measures.
Building this framework collaboratively across marketing, sales, product, and customer success, rather than having a single function impose its own definition of success on everyone else, produces a version the whole organization genuinely trusts and references consistently.
| Framework Element | Purpose | Owner |
|---|---|---|
| North Star Metric | Single measure of overall GTM health | Executive leadership |
| Strategic KPIs | Track progress toward major goals | Functional leadership |
| Operational KPIs | Monitor day to day execution health | Team managers |
| Leading Indicators | Predict future performance early | Cross functional analytics |
Optimization Principles
Optimization principles establish the guiding philosophy behind how the organization uses data to improve, such as prioritizing evidence over opinion when resolving disagreements, testing changes on a smaller scale before full rollout, and treating underperformance as a diagnostic opportunity rather than purely a cause for blame.
Embedding a genuinely blameless approach to performance review, focused on understanding root causes rather than assigning fault, encourages more honest reporting and more effective problem solving than a culture where underperformance is met primarily with pressure and scrutiny directed at individuals.
Executive Performance Goals
Executive performance goals connect the measurement framework directly to the specific outcomes senior leadership cares about most, ensuring the metrics tracked throughout the organization ultimately roll up into the handful of numbers that genuinely matter at the board and leadership level.
Confirming this connection explicitly, rather than assuming operational metrics naturally align with executive priorities, prevents a scenario where teams optimize diligently for metrics that ultimately have little bearing on the outcomes leadership actually cares about most.
GTM Performance Framework
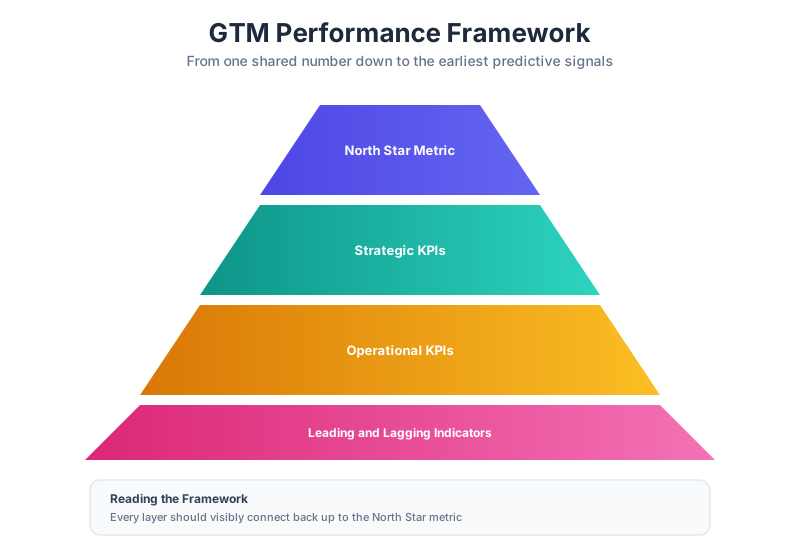
A well structured performance framework organizes metrics into a clear hierarchy that connects daily execution to overall business health.
North Star Metrics
A North Star metric captures the single most important measure of overall go to market health, chosen specifically because it correlates strongly with long term business success and gives the entire organization one clear, shared number to rally around.
Choosing a North Star metric genuinely well requires resisting the temptation to pick a number that simply looks impressive, favoring instead one that authentically reflects whether customers are receiving lasting value, since a metric disconnected from genuine customer outcomes eventually loses its usefulness as a true north for the organization.
It is worth testing a candidate North Star metric against a simple question: if this number improved significantly while every other aspect of the business stayed the same, would that genuinely represent a healthier company. A metric that fails this test, such as pure signup volume without any corresponding measure of retention or value delivered, is probably not the right choice regardless of how appealing it looks on a slide.
Strategic KPIs
Strategic KPIs track progress toward the major goals sitting just beneath the North Star metric, typically including measures such as revenue growth rate, market share, or customer retention that reflect meaningful strategic progress over a quarterly or annual time horizon.
Limiting strategic KPIs to a genuinely small number, typically no more than four or five, keeps leadership attention focused on what matters most rather than diluting focus across an overly broad set of competing priorities that individually receive less serious attention.
| Metric Type | Time Horizon | Example |
|---|---|---|
| North Star Metric | Ongoing, always visible | Net revenue retention |
| Strategic KPIs | Quarterly to annual | Revenue growth rate, market share |
| Operational KPIs | Weekly to monthly | Pipeline generated, activities completed |
| Leading Indicators | Daily to weekly | Trial signups, engagement scores |
Operational KPIs
Operational KPIs track the day to day execution metrics that feed into strategic progress, such as pipeline generated, activities completed, or content published, giving teams a more immediate, actionable view of whether current effort is on track to support the longer term goals above it.
Reviewing operational KPIs frequently, ideally weekly, allows teams to make small course corrections quickly rather than discovering only at the end of a quarter that activity levels never actually supported the strategic goals they were meant to serve.
Leading Indicators
Leading indicators are metrics that move before the outcomes they eventually predict become fully visible, such as trial signup rate or early product engagement, giving teams an early warning system that allows course correction well before a lagging metric like churn or revenue confirms a problem has already fully materialized.
Identifying genuinely predictive leading indicators, rather than metrics that merely feel intuitively important, requires validating the actual historical correlation between a candidate leading indicator and the lagging outcome it is meant to predict, since not every plausible sounding early signal turns out to be reliably predictive in practice.
Lagging Indicators
Lagging indicators confirm outcomes after they have already occurred, such as closed revenue or customer churn, providing the definitive measure of actual results but arriving too late on their own to inform fast, proactive adjustments to current strategy.
Pairing every important lagging indicator with at least one corresponding leading indicator gives an organization both the definitive measure of what actually happened and the early warning system needed to influence outcomes before they are already locked in.
Funnel Performance Analysis
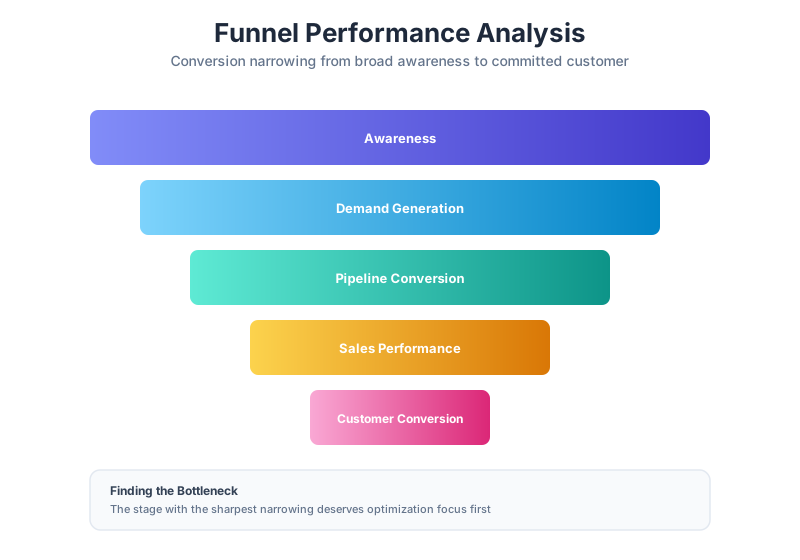
Analyzing performance across the full customer funnel reveals exactly where the go to market motion performs well and where it loses potential customers.
Awareness Performance
Awareness performance measures how effectively the organization builds recognition and visibility within its target market, typically tracked through metrics such as reach, impressions, and branded search volume that indicate growing familiarity even before a prospect actively engages further.
Tracking branded search volume over time offers a particularly useful proxy for genuine awareness growth, since it reflects prospects actively seeking out the company by name rather than passively encountering an advertisement, indicating a deeper level of market recognition taking hold.
Demand Generation
Demand generation performance tracks how effectively awareness converts into expressed interest, such as content downloads, webinar signups, or other engagement signals that indicate a prospect has moved beyond passive awareness toward active curiosity.
Distinguishing genuine demand generation from simple awareness building matters considerably here, since a piece of content that reaches many people but generates little genuine engagement signals a different kind of performance than one reaching fewer people but converting a much higher share into active interest.
| Funnel Stage | Key Metric | What It Reveals |
|---|---|---|
| Awareness | Reach, branded search volume | Growing market recognition |
| Demand Generation | Content engagement, signups | Conversion from awareness to interest |
| Pipeline Conversion | Lead to opportunity rate | Quality of generated demand |
| Sales Performance | Win rate, sales cycle length | Effectiveness of the sales process |
| Customer Conversion | Trial to paid conversion | Strength of the final purchase decision |
Pipeline Conversion
Pipeline conversion measures how effectively generated leads and opportunities move into genuinely qualified sales pipeline, revealing whether marketing and early stage sales efforts are producing prospects who are actually ready for deeper sales engagement.
A low pipeline conversion rate often points to a qualification problem rather than a fundamental demand problem, meaning the fix may lie in sharpening lead qualification criteria rather than simply generating a larger volume of leads that convert at the same disappointing rate.
Sales Performance
Sales performance within the funnel tracks how effectively qualified pipeline converts into closed revenue, including metrics such as win rate and sales cycle length that reveal how well the sales process itself performs once a prospect reaches active evaluation.
Segmenting sales performance by deal size, segment, and competitor reveals patterns a single blended win rate would otherwise obscure, often showing that overall performance masks significant variation between where the sales team consistently wins and where it consistently struggles.
Customer Conversion
Customer conversion measures the final step from trial or initial purchase into a fully committed, paying customer, revealing whether the product and onboarding experience deliver enough value to convert genuine interest into a lasting relationship.
A weak customer conversion rate despite strong upstream funnel performance often points directly toward an onboarding or initial product experience problem, since it suggests prospects are genuinely interested but something in the early hands on experience fails to confirm that initial interest was well placed.
Funnel Bottlenecks
Funnel bottleneck analysis identifies the specific stage where the largest proportion of potential customers is lost, directing optimization effort toward the point in the journey where improvement would have the greatest overall impact on final conversion.
Focusing improvement effort on the single most significant bottleneck first, rather than attempting to optimize every stage simultaneously, tends to produce a more meaningful overall impact on final conversion than spreading limited attention thinly across the entire funnel at once.
It is also worth revisiting bottleneck analysis after each significant optimization effort, since resolving one bottleneck often simply shifts the constraint to whichever stage becomes the next largest source of lost conversion, a pattern familiar from operations research more broadly and one that applies just as clearly to a sales and marketing funnel.
Marketing & Sales Performance
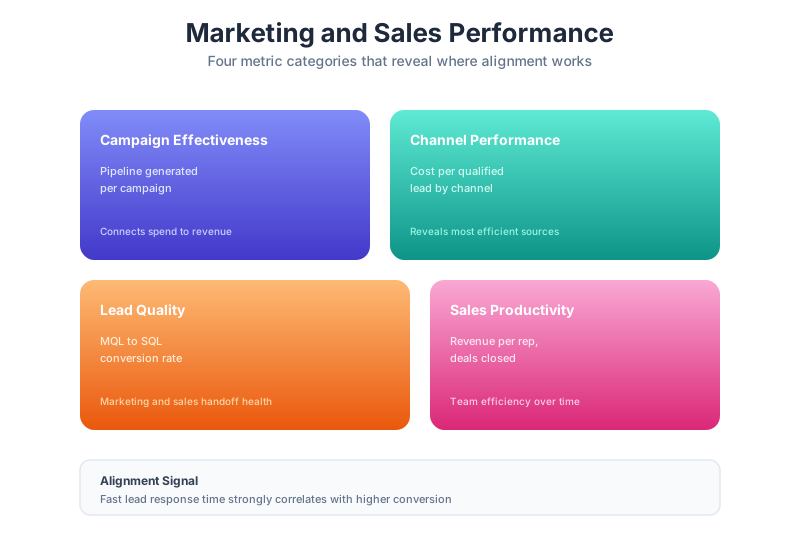
Beyond the funnel as a whole, specific marketing and sales metrics reveal where these two closely connected functions perform well and where friction remains.
Campaign Effectiveness
Campaign effectiveness measures how well specific marketing initiatives perform against their stated goals, connecting campaign investment directly to resulting pipeline and revenue rather than evaluating campaigns purely on softer engagement metrics disconnected from genuine business impact.
Establishing the specific success metric for a campaign before it launches, rather than deciding after the fact which metric happened to look most favorable, keeps campaign evaluation honest and genuinely useful for informing future investment decisions.
Channel Performance
Channel performance metrics compare how efficiently different acquisition channels generate qualified pipeline and revenue, revealing which channels deserve continued or increased investment and which may need reconsideration or optimization.
Comparing channels on a genuinely apples to apples basis, accounting for differences in typical deal size and sales cycle length across channels, prevents a misleading conclusion that one channel underperforms simply because it happens to attract a different type of buyer than another.
Reviewing channel performance data over a long enough time horizon also matters, since some channels produce results that materialize gradually over months, and judging them against the same short evaluation window used for faster, more immediate channels can lead to prematurely abandoning an investment that simply needed more time to mature.
| Metric Category | Example Metric | Primary Insight |
|---|---|---|
| Campaign Effectiveness | Pipeline generated per campaign | Which campaigns genuinely drive revenue |
| Channel Performance | Cost per qualified lead by channel | Where acquisition investment is most efficient |
| Lead Quality | Marketing qualified to sales qualified rate | Whether marketing generates genuinely sales ready leads |
| Sales Productivity | Revenue per rep | Individual and team efficiency |
Lead Quality
Lead quality metrics evaluate how well marketing generated leads actually convert into sales qualified opportunities, revealing whether marketing is optimizing purely for volume or genuinely producing leads sales can convert into real pipeline.
Reviewing lead quality collaboratively with sales, rather than marketing evaluating it purely on its own internal criteria, ensures the definition of a qualified lead genuinely reflects what sales actually finds valuable to receive rather than a metric marketing has defined in isolation.
Sales Productivity
Sales productivity metrics evaluate how efficiently the sales team converts its effort and time into closed revenue, helping identify whether the team has adequate capacity, tools, and support to hit its targets consistently.
Watching productivity trends over time, rather than only reviewing a single snapshot, reveals whether recent investments in enablement, tooling, or process changes are genuinely translating into improved sales efficiency across the team.
Revenue Contribution
Revenue contribution analysis breaks down closed revenue by source, channel, and campaign, providing the clearest picture of where genuine business impact originates across the full marketing and sales motion.
Building reliable attribution for this analysis requires reasonably consistent tracking practices across the full customer journey, since gaps or inconsistencies in tracking can quietly distort the picture of where revenue genuinely originates, leading to misallocated future investment.
Marketing and Sales Alignment Metrics
Marketing and sales alignment metrics track how well these two functions coordinate in practice, such as lead response time and shared pipeline visibility, revealing whether the handoff between generating and converting demand actually works smoothly.
A slow lead response time in particular deserves close attention, since research consistently shows that the odds of successfully converting a lead drop sharply the longer a prospect waits for a follow up after expressing initial interest.
Customer Performance Metrics
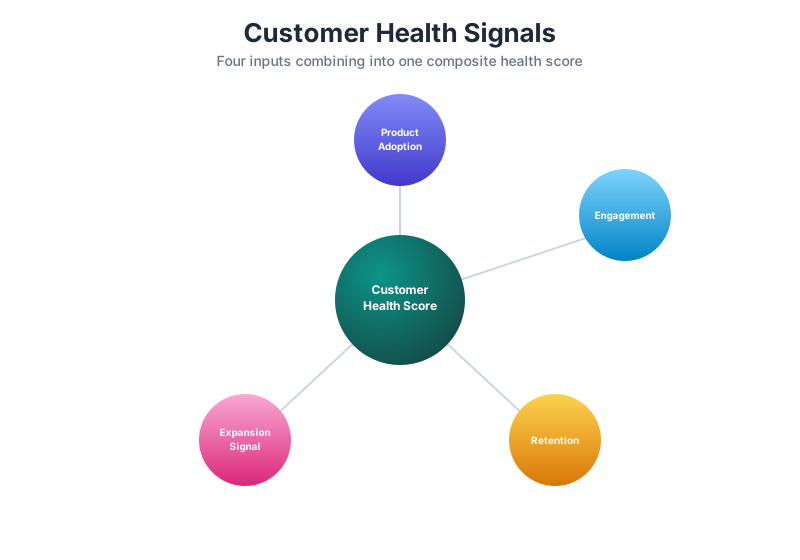
Beyond acquisition, understanding how customers actually experience and derive value from the product reveals the health of the broader business.
Product Adoption
Product adoption metrics track how deeply and consistently customers actually use the product after purchasing it, revealing whether the value proposition that drove the initial sale is genuinely being realized in ongoing practice.
Tracking adoption of specific high value features, rather than only overall login frequency, often reveals more actionable insight, since a customer logging in regularly but never engaging with the core capability that drove their purchase decision may still be at meaningful risk of eventual churn.
Sharing adoption data directly with customer success teams, broken down to the individual account level, gives them a concrete, specific basis for proactive outreach, such as offering targeted guidance toward a valuable feature an account has not yet discovered on their own.
Customer Engagement
Customer engagement metrics track how actively customers interact with the product and company over time, providing an early signal of health that often moves well before more definitive outcomes like renewal or churn become visible.
Watching for meaningful declines in engagement, rather than only absolute engagement levels, often reveals risk earlier, since a customer whose usage has dropped noticeably from their own previous baseline may be at real risk even if their absolute usage still looks reasonable compared to other accounts.
| Metric Category | Example Metric | Why It Matters |
|---|---|---|
| Product Adoption | Feature usage depth | Confirms value is genuinely being realized |
| Customer Engagement | Login frequency, active usage | Early signal of overall account health |
| Retention | Logo and revenue retention rate | Core measure of business durability |
| Expansion | Upsell and cross-sell revenue | Growth potential from existing base |
Retention
Retention metrics measure how many customers and how much revenue the business retains over time, serving as one of the most fundamental indicators of whether the product and overall customer experience genuinely deliver lasting value.
Tracking both logo retention, meaning the number of customers retained, and revenue retention, meaning the dollar value retained, separately matters considerably, since a business can retain most of its logos while still losing meaningful revenue if larger accounts churn disproportionately more often than smaller ones.
Net revenue retention, which accounts for both losses from churn and gains from expansion within the existing customer base, often provides the single most informative version of this metric, since a business can post genuinely healthy retention overall even while individual customer churn continues at a moderate rate, provided expansion among remaining customers more than compensates for it.
Expansion Opportunities
Expansion opportunity metrics identify accounts showing signs of readiness for additional seats, usage, or upsell, representing a valuable and relatively efficient source of growth compared to acquiring entirely new customers.
Building simple, automated alerts that flag accounts approaching usage thresholds or showing other clear expansion signals gives customer success and sales teams a practical, timely way to act on this opportunity rather than relying on manual review to catch it.
Customer Health
Customer health scoring combines multiple signals, such as usage, engagement, and support interactions, into a single composite view that helps customer success teams prioritize attention toward accounts showing early warning signs before they escalate into a genuine churn risk.
Validating a health scoring model against actual historical churn and renewal outcomes, rather than assuming the chosen signals are inherently predictive, ensures the score genuinely identifies at risk accounts rather than simply feeling intuitively reasonable without demonstrated accuracy.
Revisiting the health scoring model periodically as more historical data accumulates allows the underlying weighting to improve over time, since the signals that best predicted churn a year ago may not remain equally predictive as the product, customer base, and competitive landscape all continue to evolve.
Lifetime Value Indicators
Lifetime value indicators estimate the total value a customer relationship is likely to generate over its full duration, combining retention, expansion, and margin data into a single forward looking measure that informs how much investment in acquiring and serving a given customer segment is genuinely justified.
Comparing lifetime value against acquisition cost by segment reveals which segments genuinely deserve the most aggressive acquisition investment, sometimes showing that a segment with a lower initial deal size actually produces stronger long term economics once retention and expansion are properly factored in.
This kind of analysis often surprises teams who have been anchoring investment decisions purely on initial deal size, since a segment with a smaller average first year contract but meaningfully higher multi year retention can, over time, generate considerably more total value than a larger segment that churns at a much higher rate.
Measurement Insights & Optimization Opportunities
Raw metrics only become valuable once translated into genuine insight and actionable next steps.
Performance Trends
Performance trend analysis looks at how key metrics have moved over time, rather than evaluating any single data point in isolation, revealing whether the business is genuinely improving, declining, or holding steady across the metrics that matter most.
Looking at trend direction alongside the rate of change matters considerably, since a metric improving slowly may warrant a very different response than one improving rapidly or one that has recently reversed an established prior trend in the opposite direction.
Strengths
Strength identification highlights the areas where current performance genuinely exceeds expectations or benchmarks, providing a clear picture of what is working well and worth protecting or even doubling down on further.
Understanding why a particular strength exists, rather than simply noting that it exists, helps the organization deliberately replicate the underlying conditions elsewhere rather than treating strong performance as a fortunate but unexplained outcome.
| Insight Type | Purpose | Example Output |
|---|---|---|
| Performance Trends | Understand trajectory over time | Win rate improving steadily each quarter |
| Strengths | Identify what to protect and scale | Referral channel significantly outperforming |
| Weaknesses | Identify what needs attention | Enterprise segment win rate declining |
| Root-Cause Analysis | Understand why a pattern exists | Declining win rate tied to new competitor entry |
Weaknesses
Weakness identification highlights areas where performance falls short of expectations, providing the honest, sometimes uncomfortable picture necessary to prioritize where genuine improvement effort should focus.
Presenting weaknesses alongside a clear plan for addressing them, rather than simply cataloging problems, keeps this analysis constructive and action oriented rather than reading as an exercise purely in identifying blame.
Root-Cause Analysis
Root-cause analysis moves beyond simply identifying that a metric has declined toward understanding why it has declined, since effective optimization requires addressing genuine underlying causes rather than treating surface level symptoms without understanding what is actually driving them.
Asking why repeatedly, continuing past the first, most obvious explanation toward a deeper underlying cause, often reveals that an apparent problem in one function actually originates from a decision or change made somewhere else entirely in the organization.
A declining win rate, for example, might initially appear to be a sales execution problem, but deeper root-cause analysis sometimes reveals the actual driver is a recent pricing change, a competitor's new capability, or a shift in the segments marketing has been generating leads from, none of which sales alone could reasonably be expected to solve on its own.
Growth Opportunities
Growth opportunity identification highlights specific, actionable areas where investment could meaningfully improve performance, drawing directly from the strengths, weaknesses, and root-cause analysis completed above.
Framing growth opportunities with a rough sense of expected impact and required effort, rather than as an open ended list of possibilities, gives the organization a more practical basis for deciding where to actually invest limited resources next.
Optimization Priorities
Optimization priorities rank the identified opportunities by expected impact and feasibility, ensuring the organization focuses its limited optimization capacity on the changes most likely to move the needle rather than spreading effort thinly across every possible improvement simultaneously.
Revisiting this prioritization regularly, rather than fixing it once and following it rigidly regardless of new information, keeps optimization work responsive to whatever the most current data actually reveals about where the greatest opportunity currently sits.
Performance Dashboard & Governance
Sustained measurement discipline requires clear dashboards and a consistent governance structure around how performance gets reviewed.
Executive Dashboard
An executive dashboard presents the small number of metrics that matter most to senior leadership in a single, easily digestible view, avoiding the common failure of overwhelming leadership with excessive detail better suited to an operational team's own working dashboard.
Designing this dashboard around a few clear, well chosen visuals rather than dense tables of raw numbers helps leadership absorb the current state of the business quickly, even during a brief review, without needing to interpret extensive data on their own.
KPI Review Cadence
KPI review cadence establishes a consistent, predictable rhythm for reviewing performance data, ensuring metrics receive regular attention rather than only being examined reactively when a problem has already become impossible to ignore.
Matching review frequency to how quickly a given metric genuinely changes prevents wasted effort reviewing slow moving strategic metrics too frequently, while ensuring faster moving operational metrics receive the closer, more frequent attention they actually require.
| Governance Element | Cadence | Primary Audience |
|---|---|---|
| Executive Dashboard Review | Monthly or quarterly | Senior leadership |
| Operational KPI Review | Weekly | Functional teams and managers |
| Deep Dive Analysis | Quarterly | Cross functional analytics and leadership |
| Annual Strategic Review | Annually | Executive leadership and board |
Reporting Framework
A reporting framework standardizes how performance data gets presented across the organization, ensuring consistent definitions and formats that make it easy to compare performance across different reporting periods and teams.
Documenting exact metric definitions and calculation methods in a shared, accessible reference prevents the confusing situation where two teams present different numbers for what should be the exact same named metric, simply because each calculated it slightly differently.
Governance Model
A governance model establishes clear ownership for each metric and dashboard, along with a defined process for updating measurement approaches as the business evolves and new questions become more important to answer than older ones.
Assigning a single clear owner for each significant metric, responsible for its accuracy and ongoing relevance, prevents the common situation where an important metric quietly becomes stale or inconsistently maintained because no one felt clearly responsible for keeping it current.
Decision-Making Process
A decision-making process clarifies how performance data actually translates into action, including who has authority to approve changes based on what the data reveals and how quickly decisions should typically follow from a clear performance signal.
Without this clarity, organizations sometimes accumulate excellent data and analysis that never actually leads anywhere, since no one feels clearly empowered to act decisively on what the data has already made apparent.
Continuous Optimization Strategy
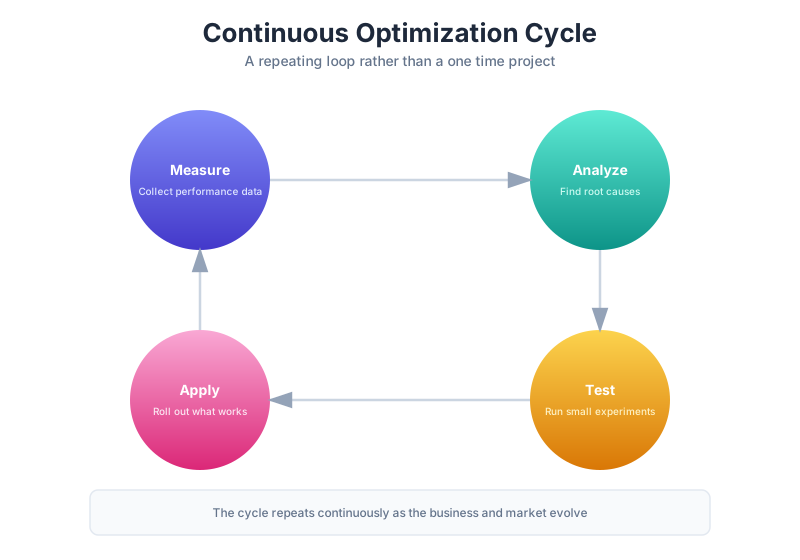
Measurement only creates value when it feeds into a genuine, ongoing cycle of improvement.
Experimentation Framework
An experimentation framework establishes a consistent, disciplined approach to testing potential improvements on a smaller scale before committing to full rollout, reducing the risk of a poorly considered change causing broader damage before its impact is properly understood.
Defining clear success criteria and a minimum sample size before running an experiment, rather than deciding what counts as success after seeing early results, keeps experimentation genuinely rigorous rather than prone to interpreting ambiguous early data however happens to be most convenient.
Building a simple, repeatable template for documenting each experiment, including its hypothesis, method, and outcome, also creates a valuable institutional record over time, preventing the organization from unknowingly repeating a test that was already tried and found unsuccessful in the past.
Optimization Roadmap
An optimization roadmap sequences planned improvement initiatives over time, ensuring the organization pursues changes in a coherent, prioritized order rather than reacting to whatever issue feels most urgent in the moment without a broader plan.
Building this roadmap collaboratively with the teams who will actually execute each initiative, rather than imposing it purely from an analytics function without direct operational context, tends to produce a plan that feels genuinely achievable rather than aspirational and disconnected from real execution capacity.
| Optimization Element | Purpose | Typical Cadence |
|---|---|---|
| Experimentation Framework | Test changes safely before full rollout | Ongoing, per initiative |
| Optimization Roadmap | Sequence improvement initiatives | Quarterly planning |
| Continuous Improvement Process | Capture and apply lessons learned | After major initiatives |
| Feedback Loops | Route insight back to relevant teams | Ongoing |
Continuous Improvement Process
A continuous improvement process establishes a regular practice of reviewing what worked and what did not across recent initiatives, ensuring lessons learned genuinely inform future planning rather than being forgotten shortly after each individual initiative concludes.
Documenting these lessons in a shared, easily searchable location, rather than allowing them to live only in the memory of whoever happened to be involved at the time, ensures the organization actually retains and applies this accumulated learning as team composition inevitably changes over time.
Feedback Loops
Feedback loops ensure insight generated through measurement and analysis actually reaches the teams positioned to act on it, whether that means routing customer feedback to product, competitive intelligence to sales, or channel performance data to marketing.
Building these loops as explicit, routine parts of how teams work together, rather than relying on insight to travel informally through occasional hallway conversations, ensures valuable data actually influences decisions consistently rather than depending on chance encounters between the right people.
Innovation Opportunities
Innovation opportunity identification looks beyond incremental optimization toward genuinely new approaches worth testing, whether that is an entirely new channel, a different pricing model, or a new way of engaging customers that current data suggests could unlock meaningfully better performance.
Setting aside a small, dedicated portion of resources specifically for this kind of more exploratory innovation work, separate from the resources allocated to incremental optimization, ensures genuinely new ideas get a fair chance to be tested rather than always losing out to safer, more predictable incremental improvements.
Measurement & Optimization Recommendations
All of the analysis above should translate into clear, actionable recommendations for improving GTM performance going forward.
Priority Improvements
Priority improvement recommendations identify the specific, highest impact changes worth pursuing first, based on the optimization priorities established earlier, rather than attempting every possible improvement simultaneously without clear sequencing.
Connecting each recommendation directly to the specific evidence supporting it makes the case considerably more persuasive to leadership and finance stakeholders who will ultimately need to approve associated budget and resourcing decisions.
KPI Enhancements
KPI enhancement recommendations identify where the current measurement framework itself needs refinement, whether that means adding a currently missing metric or retiring one that no longer provides genuinely useful signal.
Periodically auditing the full set of tracked metrics against whether each one still genuinely informs a real decision prevents the common problem of a metric dashboard growing cluttered over time with measures that made sense once but no longer serve a clear, active purpose.
Process Optimization
Process optimization recommendations identify specific operational changes, such as adjusting a reporting cadence or clarifying metric ownership, that could improve how effectively the organization actually uses its performance data.
These recommendations often prove just as valuable as more visible strategic changes, since a genuinely well designed measurement framework can still fail to drive real improvement if the surrounding operational process for reviewing and acting on it remains poorly defined.
Technology Recommendations
Technology recommendations identify tools or platform investments that could improve data collection, analysis, or dashboard accessibility, ensuring the organization can actually act on insights rather than struggling with fragmented or unreliable underlying data.
Prioritizing data quality and integration improvements before investing in more sophisticated analysis tools tends to produce better results, since even the most advanced analytics platform cannot compensate for fundamentally unreliable or inconsistent underlying data feeding into it.
90-Day Optimization Roadmap
A ninety day optimization roadmap translates the broader recommendations into a specific, near term action plan, giving the organization a clear, manageable sequence of initial steps toward better measurement and genuinely improved performance.
Breaking this roadmap into clear phases with specific deliverables and named owners keeps the plan accountable, giving the organization natural checkpoints to assess progress and adjust course if early implementation reveals the original plan needs refinement.
Executive Performance Summary
The executive summary condenses the full measurement and optimization analysis into a format leadership can review quickly without needing to revisit every underlying section in detail.
Overall GTM Performance
This section provides an honest, high level assessment of how the overall go to market motion is currently performing, giving leadership a clear, realistic starting point for understanding where the business genuinely stands.
Presenting this assessment candidly, including genuine areas of underperformance rather than only favorable highlights, ultimately serves the organization better, since strategic decisions grounded in an accurate picture tend to hold up far better than those based on an overly optimistic account of current performance.
Key Insights
Key insight summary highlights the two or three most important findings from the full analysis, stated plainly and backed by the strongest available data rather than an exhaustive restatement of every metric reviewed.
Prioritizing insights that genuinely challenge an existing assumption or reveal a previously unrecognized opportunity tends to be more valuable to leadership than insights that simply confirm what the organization already believed to be true.
Critical Improvement Areas
Critical improvement area summary highlights where the business most urgently needs to focus optimization effort, connecting directly back to the priority recommendations established earlier in the analysis.
Naming these areas explicitly, rather than leaving them implicit, gives leadership a clear basis for allocating attention and resources toward the specific parts of the business most in need of focused improvement.
Strategic Recommendations
Strategic recommendation summary translates the broader analysis into a short, clear set of high level direction for where the business should focus its ongoing measurement and optimization investment.
Framing each recommendation alongside its expected impact and required resourcing helps leadership weigh these priorities fairly against other competing business needs, rather than evaluating each request in isolation without a clear sense of relative importance.
Executive Next Steps
The summary should close with a short, clear set of next steps for leadership, whether that is approving the ninety day roadmap, committing resources to a specific technology investment, or personally reinforcing a stronger data driven decision making culture across the organization.
Pairing each next step with a clear sense of what specifically is being asked of leadership, whether that is a decision, a budget commitment, or visible personal reinforcement, helps ensure the summary translates into genuine action rather than passive acknowledgment.
Measurement and optimization, like every other part of go to market strategy, is never truly finished. The strongest organizations treat this work as a permanent, ongoing discipline rather than a project completed once, recognizing that the questions worth asking about performance continue to evolve as the business, the market, and customer expectations keep changing over time. Treating measurement as a continuously maintained capability, rather than a dashboard built once and left unattended, keeps a business genuinely capable of understanding itself clearly enough to keep improving, quarter after quarter, as conditions around it continue to shift.
Contents