
AI Adoption in B2B GTM
Who is actually adopting AI across B2B revenue teams, where adoption stalls between pilot and scale, and why the investment-impact gap is the defining adoption story of 2026.
Published 2026-08-01
1. Executive Summary
Asset 1 in this series established that AI adoption in B2B revenue teams looks close to universal on the surface, with 81 percent of B2B sales teams using AI in some capacity. This asset goes underneath that headline number to answer a more precise question: adoption of what, by whom, and to what depth. The answer reshapes how the headline figure should be read.
The most consequential finding across the research synthesized here is not an adoption rate. It is a maturity gap. McKinsey's State of AI research finds that 88 percent of organizations now use AI in at least one business function, yet only about one percent consider their AI strategy mature. BCG and McKinsey data cited across multiple 2026 sources shows AI investment has grown to roughly 1.7 percent of revenue at the median company, while a widely cited MIT analysis finds 95 percent of enterprise AI pilots deliver no measurable profit and loss impact. Adoption, in other words, has become nearly universal at the shallowest level and remains exceptionally rare at the level that actually changes commercial outcomes.
This asset breaks that gap down along four dimensions that matter specifically for B2B go to market: company size, since enterprise and SMB organizations are adopting through different mechanisms and at different depths; GTM function, since customer-facing functions have moved further than revenue operations and other connective functions; adoption stage, since the distance between piloting and scaling has become the real dividing line, not the distance between using AI and not using it; and realized return, since the gap between AI budget growth and measurable revenue impact is now large enough to be a board-level credibility issue rather than a rounding error.
For revenue leaders, the practical implication is that benchmarking AI adoption against a single industry-wide percentage is close to meaningless. The more useful benchmark is stage-specific and function-specific: where does your organization actually sit on the maturity curve, in which functions, and is your investment concentrated at the stage where most organizations currently stall.
The sections that follow build this case in stages. Section 3 establishes the current adoption landscape at the level of precision this asset argues for, separating any-use adoption from scaled and mature deployment. Section 4 details six trends explaining why the maturity gap persists and where it is narrowing fastest. Section 5 compares how McKinsey, BCG, MIT, Deloitte, and KPMG each explain the same underlying gap from different angles. Section 6 presents Elevate's own synthesis, including a proprietary view of how functional adoption gaps compound rather than stay contained. Sections 7 through 9 translate that analysis into recommendations, executive takeaways, and a forward view of how adoption measurement itself needs to change.
2. Research Methodology
This asset follows the same Elevate research asset formula used throughout this series: analyst research, public data, proprietary analysis, and Elevate perspective, applied consistently for comparability across all 30 assets.
Sources synthesized
This report draws on adoption-specific survey and benchmark research from McKinsey's State of AI series, BCG and MIT joint research on AI return on investment, Deloitte's State of AI in the Enterprise report and its regional breakdowns, KPMG's quarterly AI Pulse Survey, Gartner's CMO Spend Survey and agentic AI forecasting, IDC pilot-to-production research, the U.S. Census Bureau's Business Trends and Outlook Survey, Forrester's B2B buyer and marketing research, and public compilations of SMB adoption data drawn from Intuit, Salesforce, and Thryv survey programs.
How Elevate adds value
Adoption statistics are unusually prone to a specific kind of distortion: different surveys define adoption differently, ranging from strict production-use definitions used by government statistical agencies to broad self-reported experimentation captured in vendor-sponsored surveys, and the resulting figures for the same underlying phenomenon can differ by a factor of three or more. Elevate's research platform uses a large language model, OpenAI's models, as its reasoning and synthesis engine, paired with a pattern intelligence layer built specifically to detect this kind of definitional mismatch across the sources it ingests, rather than treating every adoption percentage as directly comparable.
In practice, this report only presents an adoption figure as a cross-source pattern once the underlying definition has been checked for comparability, and it explicitly separates strict production-use figures, such as Census Bureau data, from broader self-reported usage figures, such as vendor survey data, rather than blending them into a single number. Every Elevate Perspective in this report is built from patterns that recur across multiple independently produced sources using comparable definitions, not from any single survey's framing, and is clearly labeled as Elevate's own synthesis.
3. Current Market Landscape
Adoption headlines in 2026 are technically accurate and, on their own, misleading. McKinsey's State of AI research finds that 88 percent of organizations use AI in at least one business function, up from 78 percent the prior year, and Gartner's enterprise application forecast, cited in Asset 1 of this series, projects that 40 percent of enterprise applications will include task-specific AI agents by the end of 2026. Both figures are accurate and both describe adoption at its shallowest, most easily cleared threshold: has the organization used AI anywhere, for anything, at any depth. Neither figure distinguishes between a team that ran a single successful pilot eighteen months ago and never expanded it, and a team that has embedded AI into the daily operating rhythm of every revenue-generating workflow it owns, yet both would be counted identically in an any-use adoption statistic.
The picture changes substantially once the threshold moves from any use to scaled, embedded use. McKinsey finds that only about one third of organizations have begun scaling AI programs organization-wide, and separate BCG and McKinsey research puts the share of organizations with genuinely mature AI deployment at roughly one percent. IDC's research on pilot outcomes adds a further data point that explains part of this gap mechanically: 88 percent of AI pilots fail to reach production at all, with failures clustering around governance, data readiness, and observability gaps rather than model quality, a finding directly consistent with the governance gap identified in Asset 1 of this series.
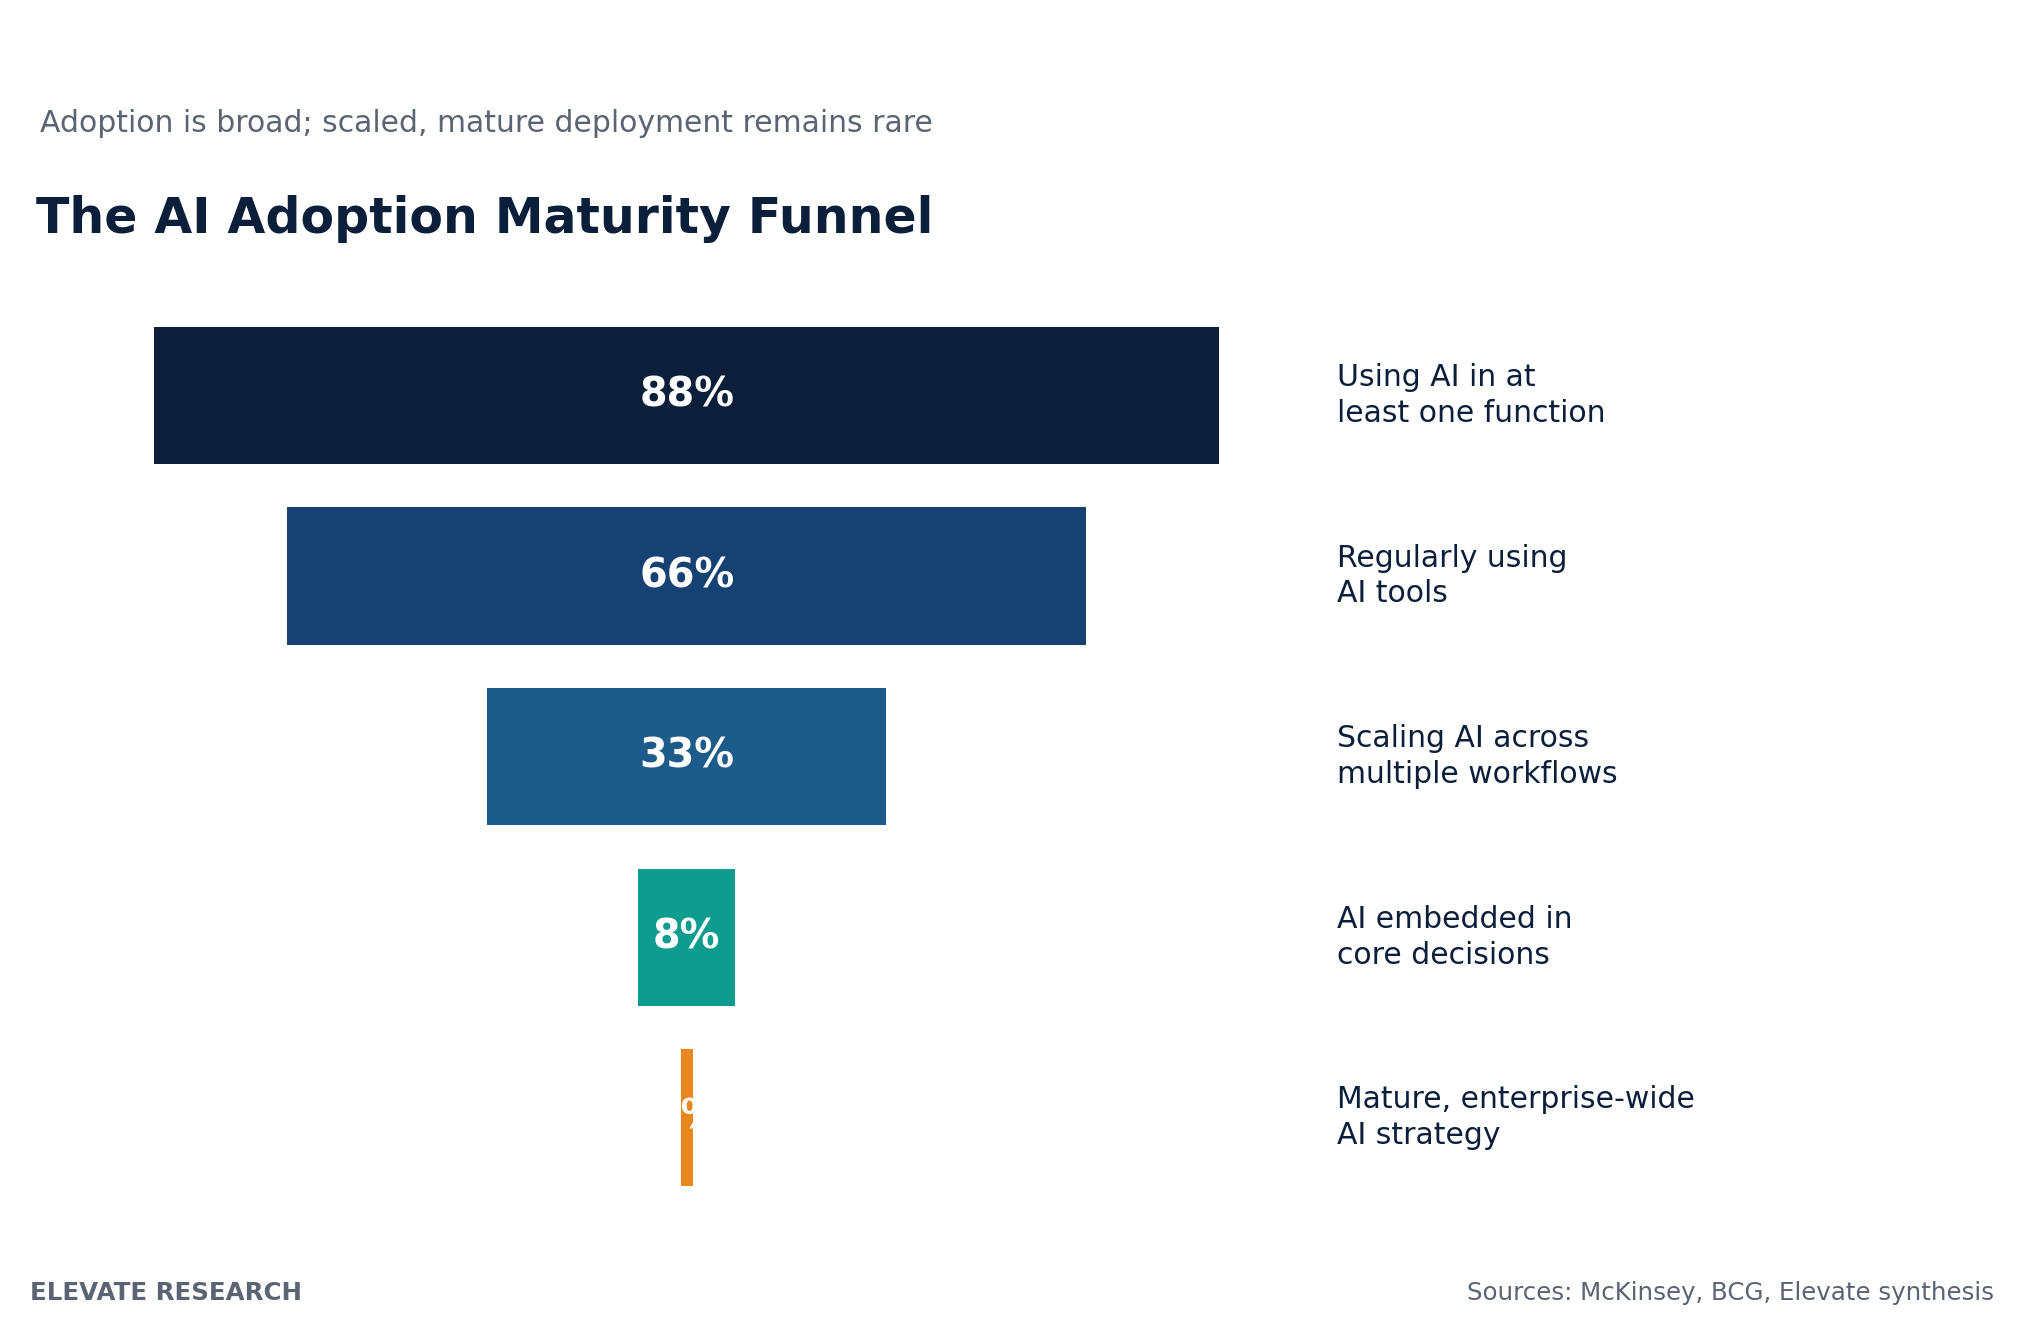 Figure 1. The share of organizations at each stage of AI adoption, from any use to mature, enterprise-wide strategy.
Adoption also varies sharply by organization size, though not in the direction some early technology cycles would predict. Enterprise organizations lead on scaled, agentic AI deployment, with roughly 25 percent reporting scaled agentic AI use compared with roughly 6 percent of SMBs, largely reflecting greater technical resources and dedicated AI budgets. At the same time, U.S. Census Bureau data shows the gap in basic AI usage between large and small businesses narrowing rapidly: large enterprises used AI at 1.8 times the rate of small businesses in early 2024, a ratio that had compressed substantially by late 2025 as turnkey agentic tools, including platforms covered in Asset 1 of this series, made basic AI adoption accessible to smaller organizations without dedicated technical teams.
1% of organizations describe their AI strategy as mature, even as 88 percent report using AI in at least one business function. Source: McKinsey State of AI research, BCG and McKinsey maturity benchmarking, 2025 to 2026
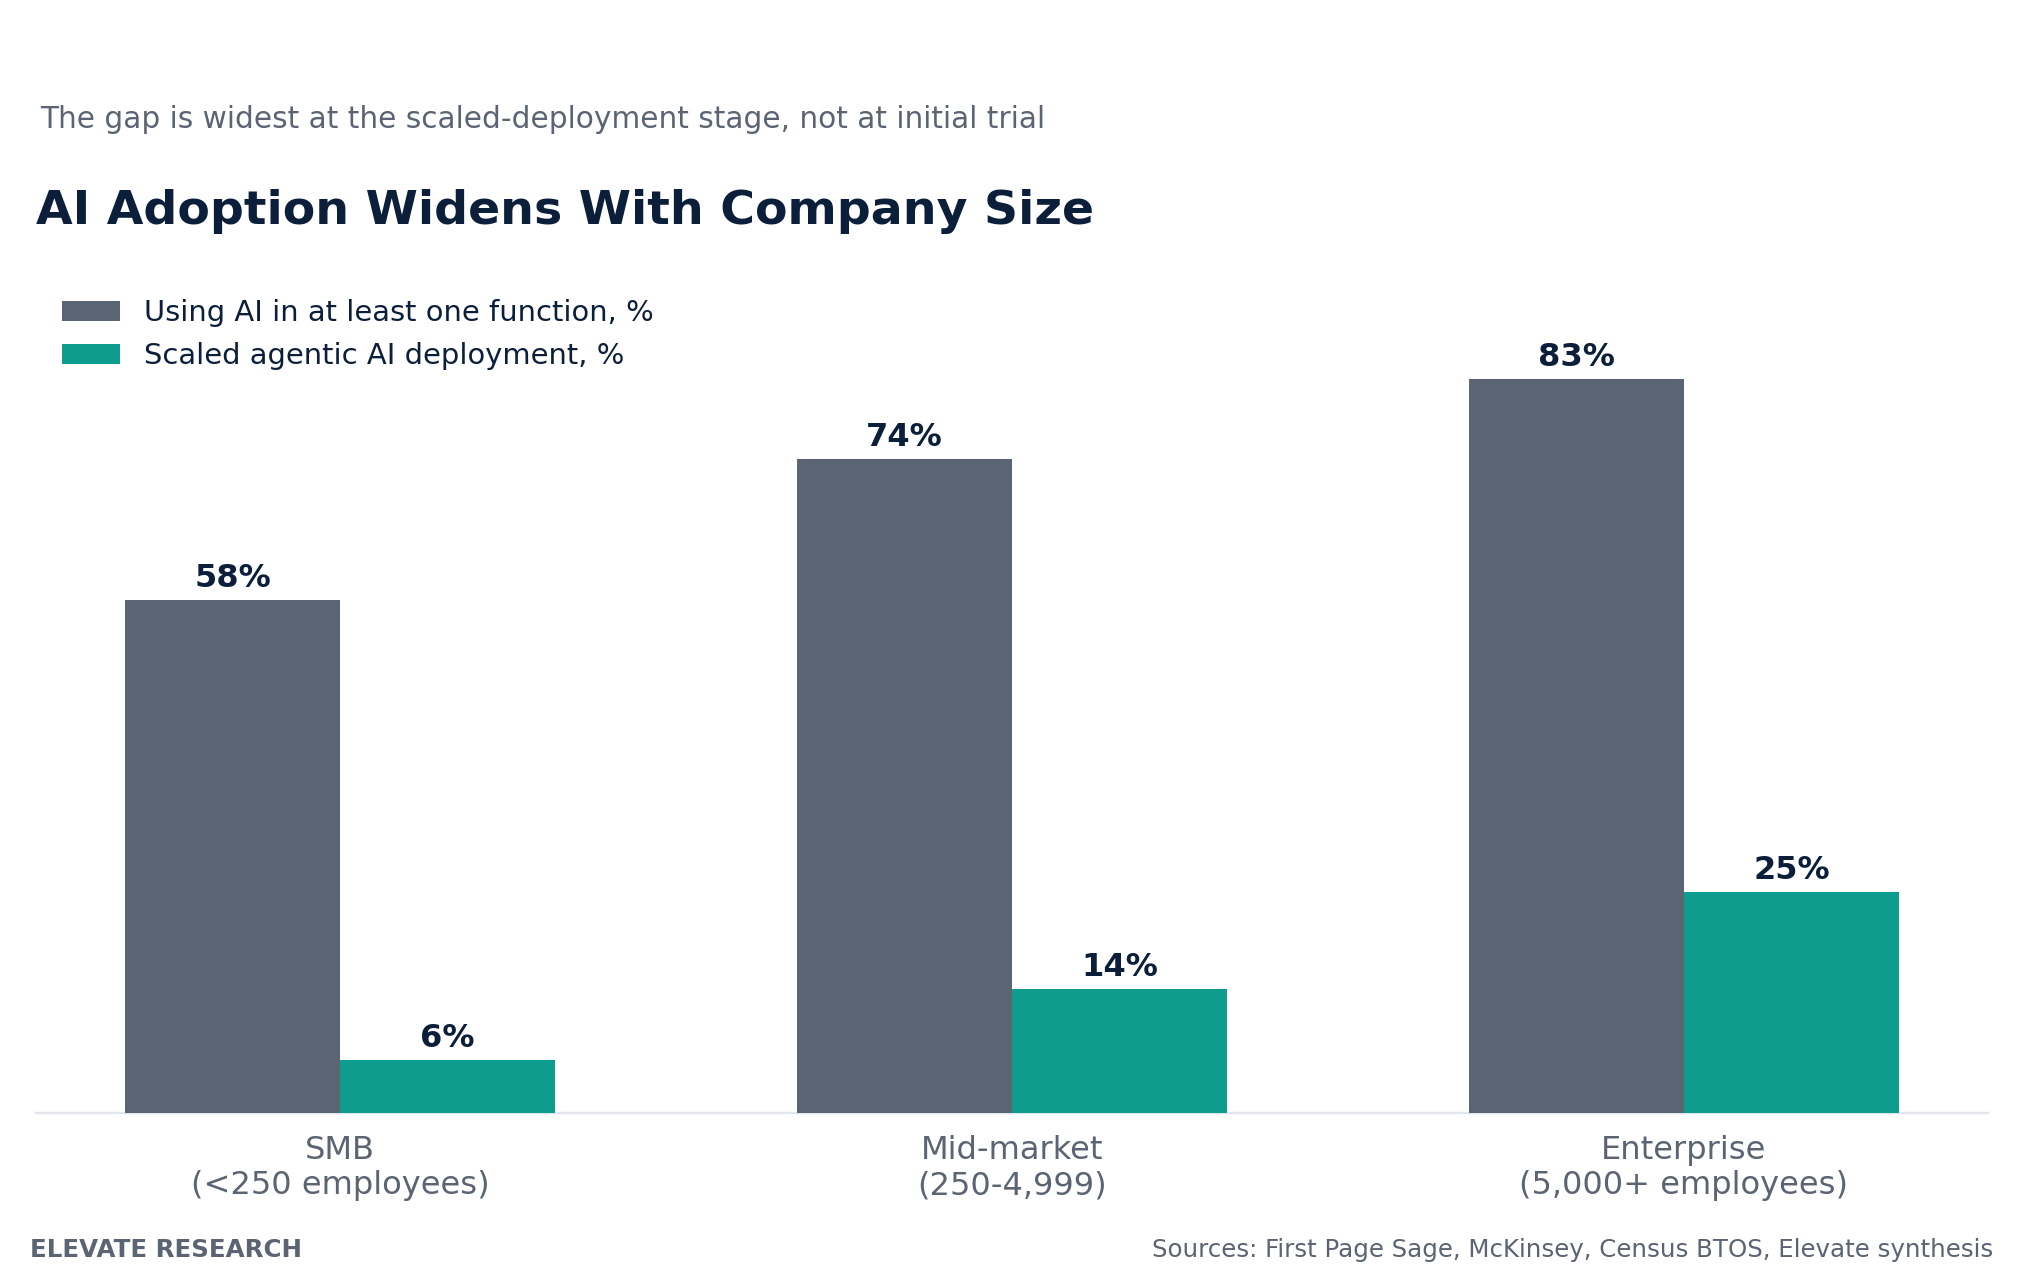 Figure 2. Any-use AI adoption narrows the gap between company sizes; scaled agentic deployment does not.
Regional variation adds a further layer of nuance directly relevant to global GTM planning. Deloitte's State of AI in the Enterprise research finds that Indian enterprises report significant or full AI usage at roughly 40 percent, compared with a global average near 28 percent, with at-scale deployment strongest in product development, strategy and operations, and marketing and sales specifically. This regional variance echoes the industry-level unevenness identified in Asset 1 of this series and reinforces that any single global adoption benchmark understates the range an internationally operating GTM organization actually needs to plan against.
The practical consequence of all of this is that adoption reporting has become, in a sense, too easy to satisfy. A GTM leader can accurately report near-universal AI adoption to a board while every function underneath that headline remains stuck in early pilots, because the reporting threshold, any use of AI anywhere, no longer distinguishes between organizations meaningfully. This is not a criticism of any individual survey; each is measuring what it defines carefully and transparently. It is a signal that the adoption benchmark itself has stopped being useful for the specific decision a revenue leader actually needs to make, which is where to allocate the next dollar of AI investment for the greatest commercial return, not whether to allocate any dollar to AI at all.
4. Key Trends
Six trends define how AI adoption is actually unfolding across B2B GTM organizations in 2026.
1. The gap between adoption and maturity is now the primary adoption story
Every major research firm reviewed for this report converges on the same shape: broad, shallow adoption at the top of the funnel, and a steep, rapid drop-off toward scaled and mature deployment. This is a meaningfully different story than the one most 2024-era adoption coverage told, which focused on whether organizations were using AI at all. In 2026, that question is close to fully answered. The open question is depth, not presence. The shape of this funnel, roughly 88 percent at the top narrowing to roughly 1 percent at the bottom, is consistent enough across independently produced sources that it should be treated as the default expectation for any organization assessing its own position, rather than as a surprising or unusual finding specific to any one survey.
2. Revenue operations lags customer-facing GTM functions in scaled deployment
Deloitte's function-level data shows customer service, marketing, and sales all reaching scaled AI deployment at meaningfully higher rates than the connective, data-centric functions that sit underneath them. This directly corroborates the readiness gap Elevate identified in Asset 1 of this series, where pricing and revenue operations showed the widest gap between current capability and target state, now confirmed by independent third-party adoption data rather than resting on Elevate's synthesis alone. The pattern is intuitive once named: customer-facing functions produce visible, demo-able AI output, such as a generated email or an automated support response, that is easy to showcase internally and easy to justify budget for, while revenue operations work, such as data model cleanup or pipeline hygiene automation, produces less visible output even when its downstream commercial impact is larger.
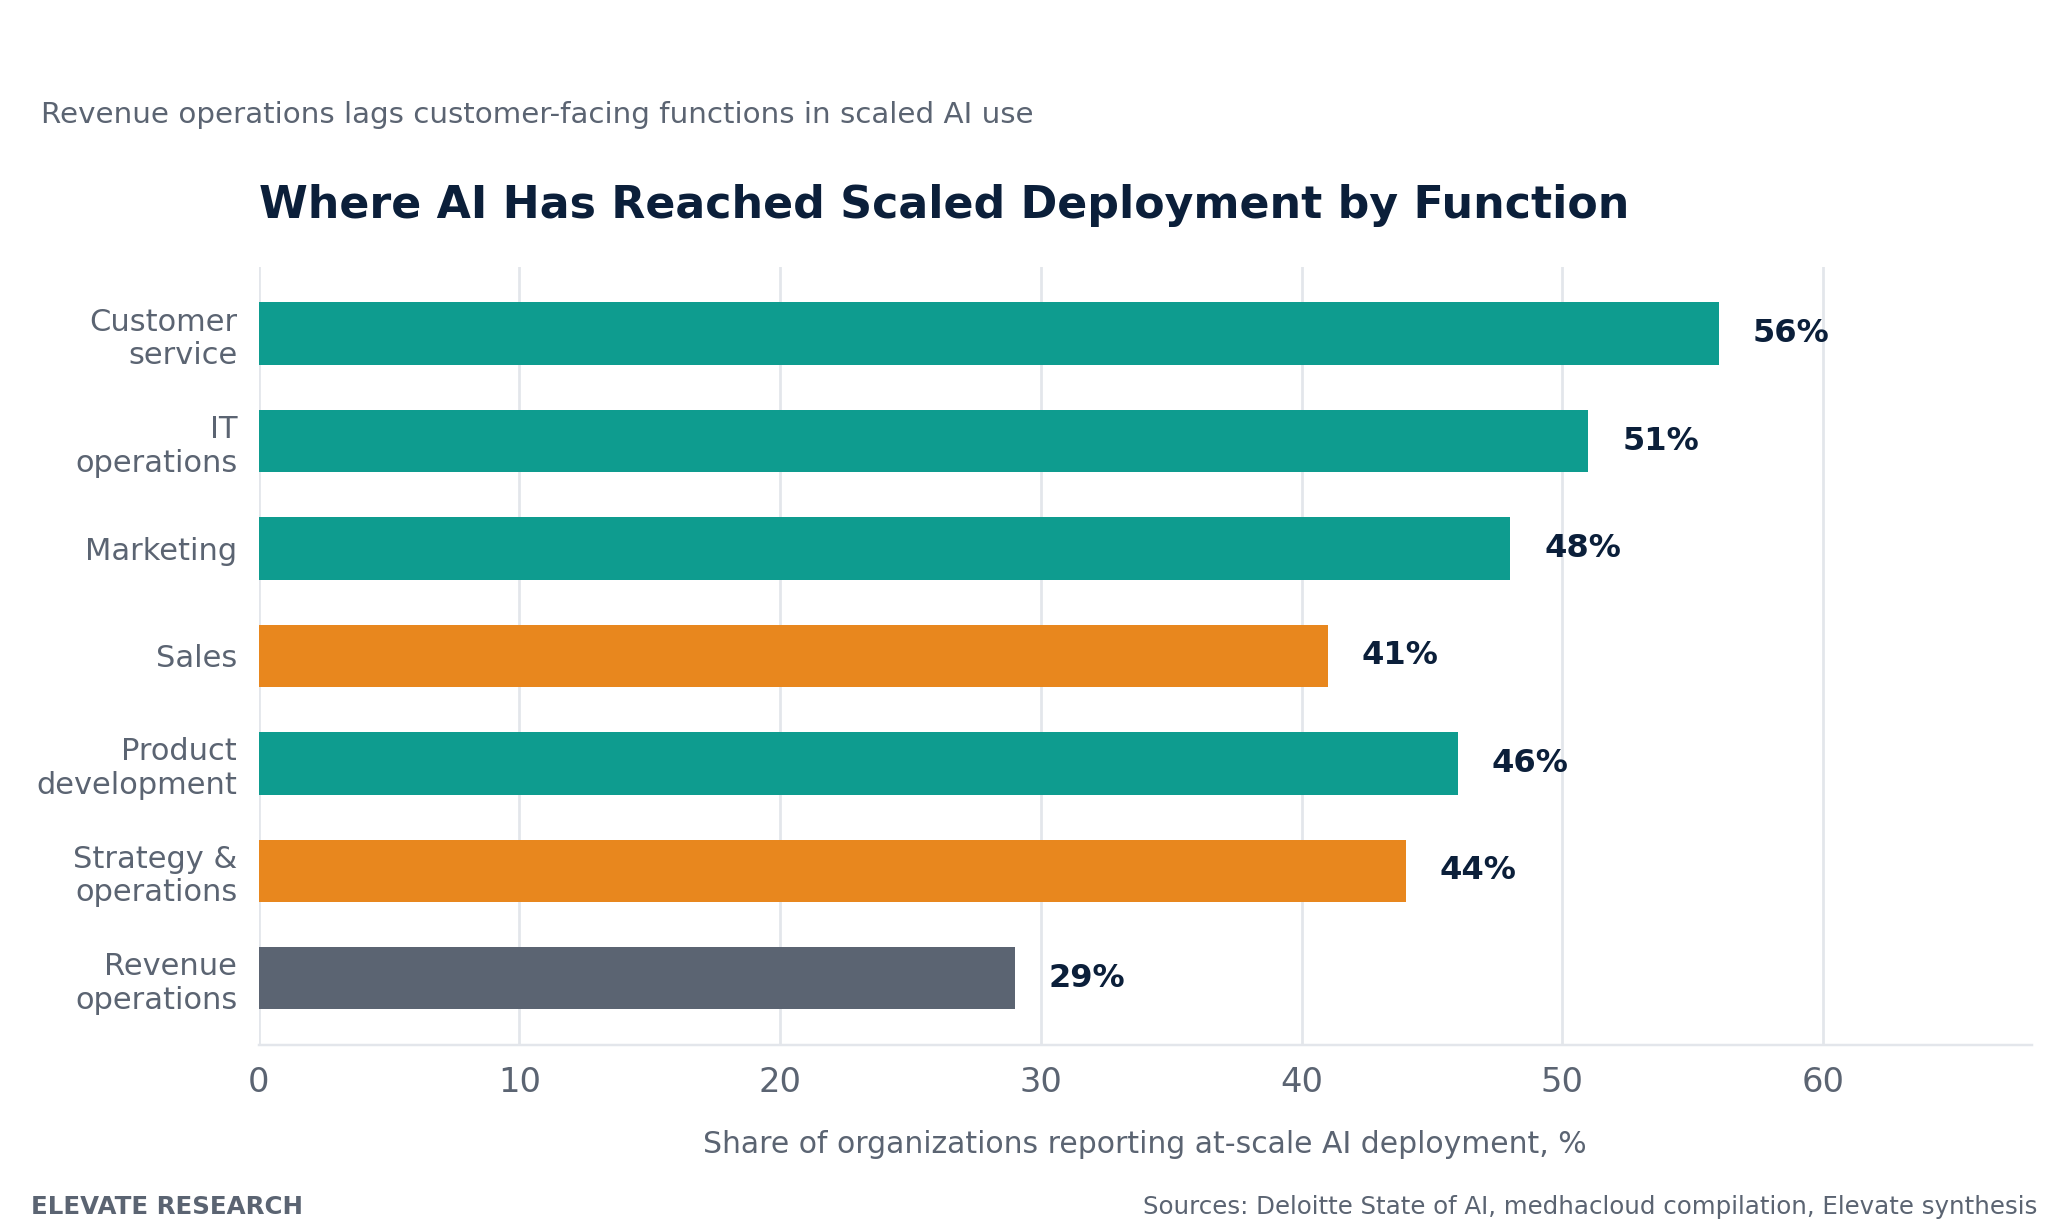 Figure 3. Share of organizations reporting at-scale AI deployment by function.
3. Budget is growing faster than the organizational capacity to deploy it well
Deloitte's research finds that 93 percent of AI budgets are allocated to technology, with only 7 percent going to the people expected to use it, a resourcing imbalance that KPMG's own research independently identifies as the top cited barrier to AI agent return on investment, with 92 percent of technology leaders citing skills gaps specifically. Read together, these findings describe an adoption pattern in which capital is not the constraint, capability is. This imbalance appears self-reinforcing in the data reviewed for this report: organizations that have not yet invested in training and change management are also disproportionately the organizations reporting low confidence in their ability to measure AI's actual commercial impact, since the discipline required to build good measurement capability is itself a people investment rather than a technology purchase.
4. Governance maturity, not model capability, determines whether budget converts to results
McKinsey's 2026 AI Trust Maturity research finds that only about 30 percent of organizations reach maturity level three or higher in strategy, governance, and agentic AI controls, with an average responsible AI maturity score of 2.3 out of 4. This finding sits directly alongside the governance gap identified in Asset 1 of this series, now with an explicit maturity scale attached, and reinforces that governance capability, not access to better models, is the differentiator between organizations that convert AI spend into results and those that do not.
5. SMB adoption is accelerating fastest, but through different mechanisms than enterprise adoption
SMB AI adoption is climbing at an unusually fast rate, with Intuit QuickBooks data showing regular AI use among small businesses rising from 48 percent in mid-2024 to 77 percent by early 2026, among the fastest technology adoption curves ever recorded in this segment. Critically, this adoption is concentrated almost entirely in marketing and customer engagement, with 77 percent of surveyed SMBs naming it their top-impact use case, a much narrower functional footprint than enterprise adoption, which spreads more evenly across customer service, IT operations, marketing, and product development.
6. B2B buyer-side adoption has outpaced seller-side operational readiness
Consistent with the buyer-seller asymmetry identified in Asset 2 of this series, Forrester's Buyers Journey research finds that 89 percent of B2B buyers have adopted generative AI as a self-guided research tool, adoption occurring at roughly three times the rate observed in consumer markets. This buyer-side figure now sits well ahead of the seller-side maturity figures described earlier in this section, reinforcing that the adoption gap most B2B GTM organizations should be most concerned about is not internal tool usage, but the gap between how their buyers already research and how their own GTM systems are built to respond.
7. Measurement definitions themselves are becoming a competitive and reporting issue
As adoption percentages converge toward saturation at the shallow end of the funnel, the specific definition an organization or survey uses to claim adoption becomes more consequential, not less. A vendor survey counting any self-reported experimentation and a government statistical agency counting only strict production use can describe the same underlying population of businesses and produce figures that differ by a factor of three or more, as this report's own methodology section addresses directly. GTM leaders reporting adoption internally, to boards, or in competitive positioning should expect increasing scrutiny of exactly what definition sits behind any adoption claim, their own or a competitor's, since the gap between generous and strict definitions is now wide enough to materially mislead a reader who assumes all adoption statistics are measuring the same thing.
5. Analyst Perspectives
The major sources reviewed for this report converge on the shape of the adoption curve while offering distinct explanations for why the maturity gap persists.
McKinsey's framing is the most consistently cited across the wider research base: AI adoption is broadening faster than AI integration. Organizations have approved tools, live use cases, and senior-level support in place, but far fewer have made the organizational changes required to convert those ingredients into consistent business value. McKinsey's finding that organizations which fully redesign workflows around AI report EBIT impact above 5 percent, compared with a fraction of that for organizations that simply layer AI onto existing processes, is one of the most direct pieces of evidence available anywhere in this research series for why the sequencing recommendations introduced in Asset 1 matter more than deployment speed.
"The firms that will benefit most from AI are unlikely to be those that simply accumulate the largest number of tools or pilots. They will be the ones that build operating models capable of turning local gains into institutional advantage." Dr. Karim Lakhani, Harvard Business School, cited in 2026 AI adoption research
BCG and MIT's joint research contributes the starkest single figure in this asset's source base: 95 percent of enterprise AI pilots deliver no measurable profit and loss impact. Rather than reading this as evidence against AI investment, both firms frame it as evidence for a specific pattern among the small minority that do succeed, organizations that pair unified technology investment with human capability investment from day one, echoing Deloitte's independent finding that budget heavily favors technology over people in the majority of organizations that have not yet closed this gap.
Deloitte's State of AI in the Enterprise research contributes the clearest evidence that this is a solvable execution problem rather than an inherent technology limitation, through its finding that Indian enterprises are outperforming the global average on at-scale deployment specifically in the functions most relevant to GTM: product development, strategy and operations, and marketing and sales. This regional outperformance suggests the maturity gap identified throughout this report reflects organizational choices about sequencing and investment, not a hard ceiling imposed by the technology itself.
KPMG's quarterly AI Pulse research adds the clearest quantification of the skills dimension of this gap, finding that 92 percent of technology leaders cite skills gaps as the top barrier to AI agent return on investment, ahead of technical, data, or budget constraints. Combined with Deloitte's finding on the technology-to-people budget imbalance, KPMG's research indicates that the maturity gap identified throughout this report is, at its root, a talent and change management problem wearing a technology costume.
Reading these five perspectives together rather than separately, a consistent division of explanatory emphasis emerges. McKinsey and BCG describe the gap in economic and organizational terms, emphasizing workflow redesign as the mechanism that converts investment into EBIT impact. Deloitte and KPMG describe it in operational and talent terms, emphasizing the specific skills and resourcing imbalances that prevent that redesign from happening. None of the five sources contradicts any other; each is examining a different layer of the same underlying phenomenon, which is precisely the kind of cross-source pattern Elevate's synthesis in the next section is built to surface explicitly rather than leave implicit.
6. Elevate Analysis
The individual data points reviewed above are widely available, several of them are among the most-cited AI statistics of 2026. What is less widely understood is how they connect into a single, coherent adoption story specific to B2B GTM organizations. Elevate's synthesis is built around that connection.
The market trend: adoption is no longer the differentiator, sequencing is
Across every source reviewed for this report, the pattern is unambiguous: nearly every organization has adopted AI in some form, which means adoption itself has stopped being a meaningful source of competitive differentiation. The differentiator that remains is sequencing, specifically whether an organization invests in workflow redesign and governance capability before or after scaling deployment.
ELEVATE PERSPECTIVE This reframes what a GTM AI adoption benchmark should actually measure. Asking "does your organization use AI" in 2026 is close to asking whether it uses email. The question that actually differentiates GTM performance is narrower and harder to answer honestly: at each stage of the maturity funnel in Figure 1, where does your organization genuinely sit, and is your current investment concentrated at the stage where the data shows most organizations stall, which is the transition from pilot to scaled, governed deployment, not the initial decision to adopt. A GTM leader who can answer that question precisely, function by function, has a more useful planning tool than one who can only cite an aggregate adoption percentage, however impressive that percentage looks in a board presentation.
Why the function-level adoption gap compounds rather than stays contained
Elevate's pattern intelligence synthesis of the functional adoption data in Section 4 surfaces a compounding risk that is not stated explicitly in any single source reviewed for this report. Because revenue operations and pricing show the lowest scaled-deployment rates among GTM-adjacent functions, and because these functions supply the data that customer-facing agents in marketing, sales, and customer service depend on, the functional adoption gap does not stay contained to the lagging function. It propagates forward into every customer-facing AI investment built on top of it. A marketing or sales agent operating on stale, poorly governed pipeline or pricing data will produce commercially unreliable output regardless of how mature the marketing or sales function's own AI adoption appears in a functional benchmark, which means functional adoption benchmarks read in isolation can materially overstate an organization's actual GTM AI readiness.
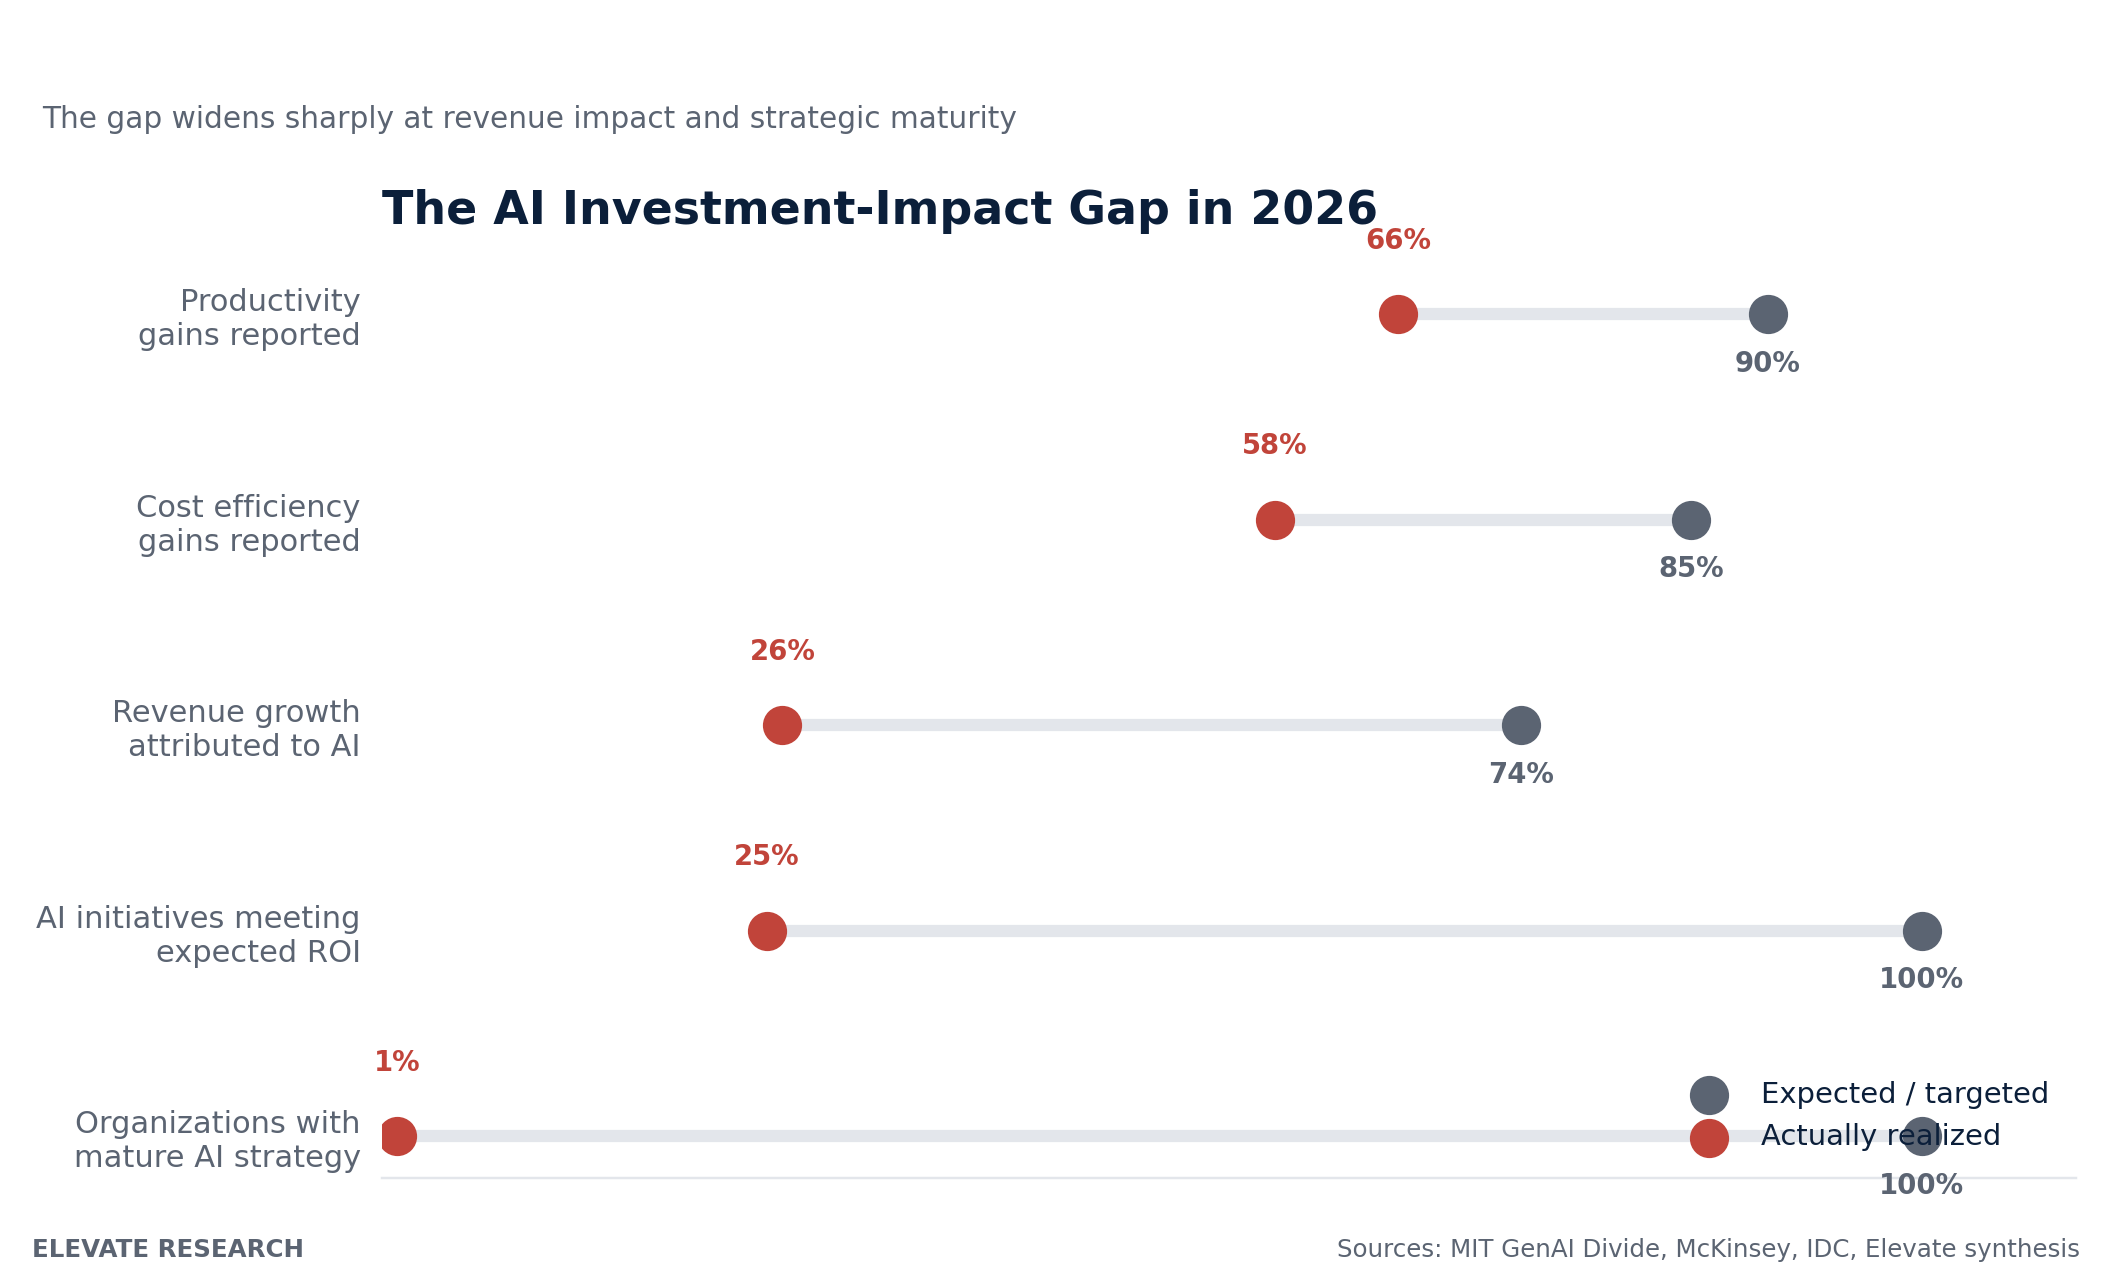 Figure 4. Expected versus realized outcomes across common AI adoption metrics, synthesized from BCG, MIT, McKinsey, and IDC research.
Why the barriers data points toward a talent problem, not a technology problem
Elevate's synthesis of barrier data across KPMG, Deloitte, and SMB-focused research finds a consistent pattern that runs counter to how many organizations frame their own AI investment decisions: the top-cited barriers to AI adoption return on investment are overwhelmingly about skills, expertise, and change management, not about model capability, data infrastructure, or budget availability. This matters directly for how the next section's recommendations should be read. An organization that responds to a stalled AI initiative by purchasing a more capable model or a broader platform license, without addressing the underlying skills and workflow redesign gap, is very likely addressing the wrong constraint.
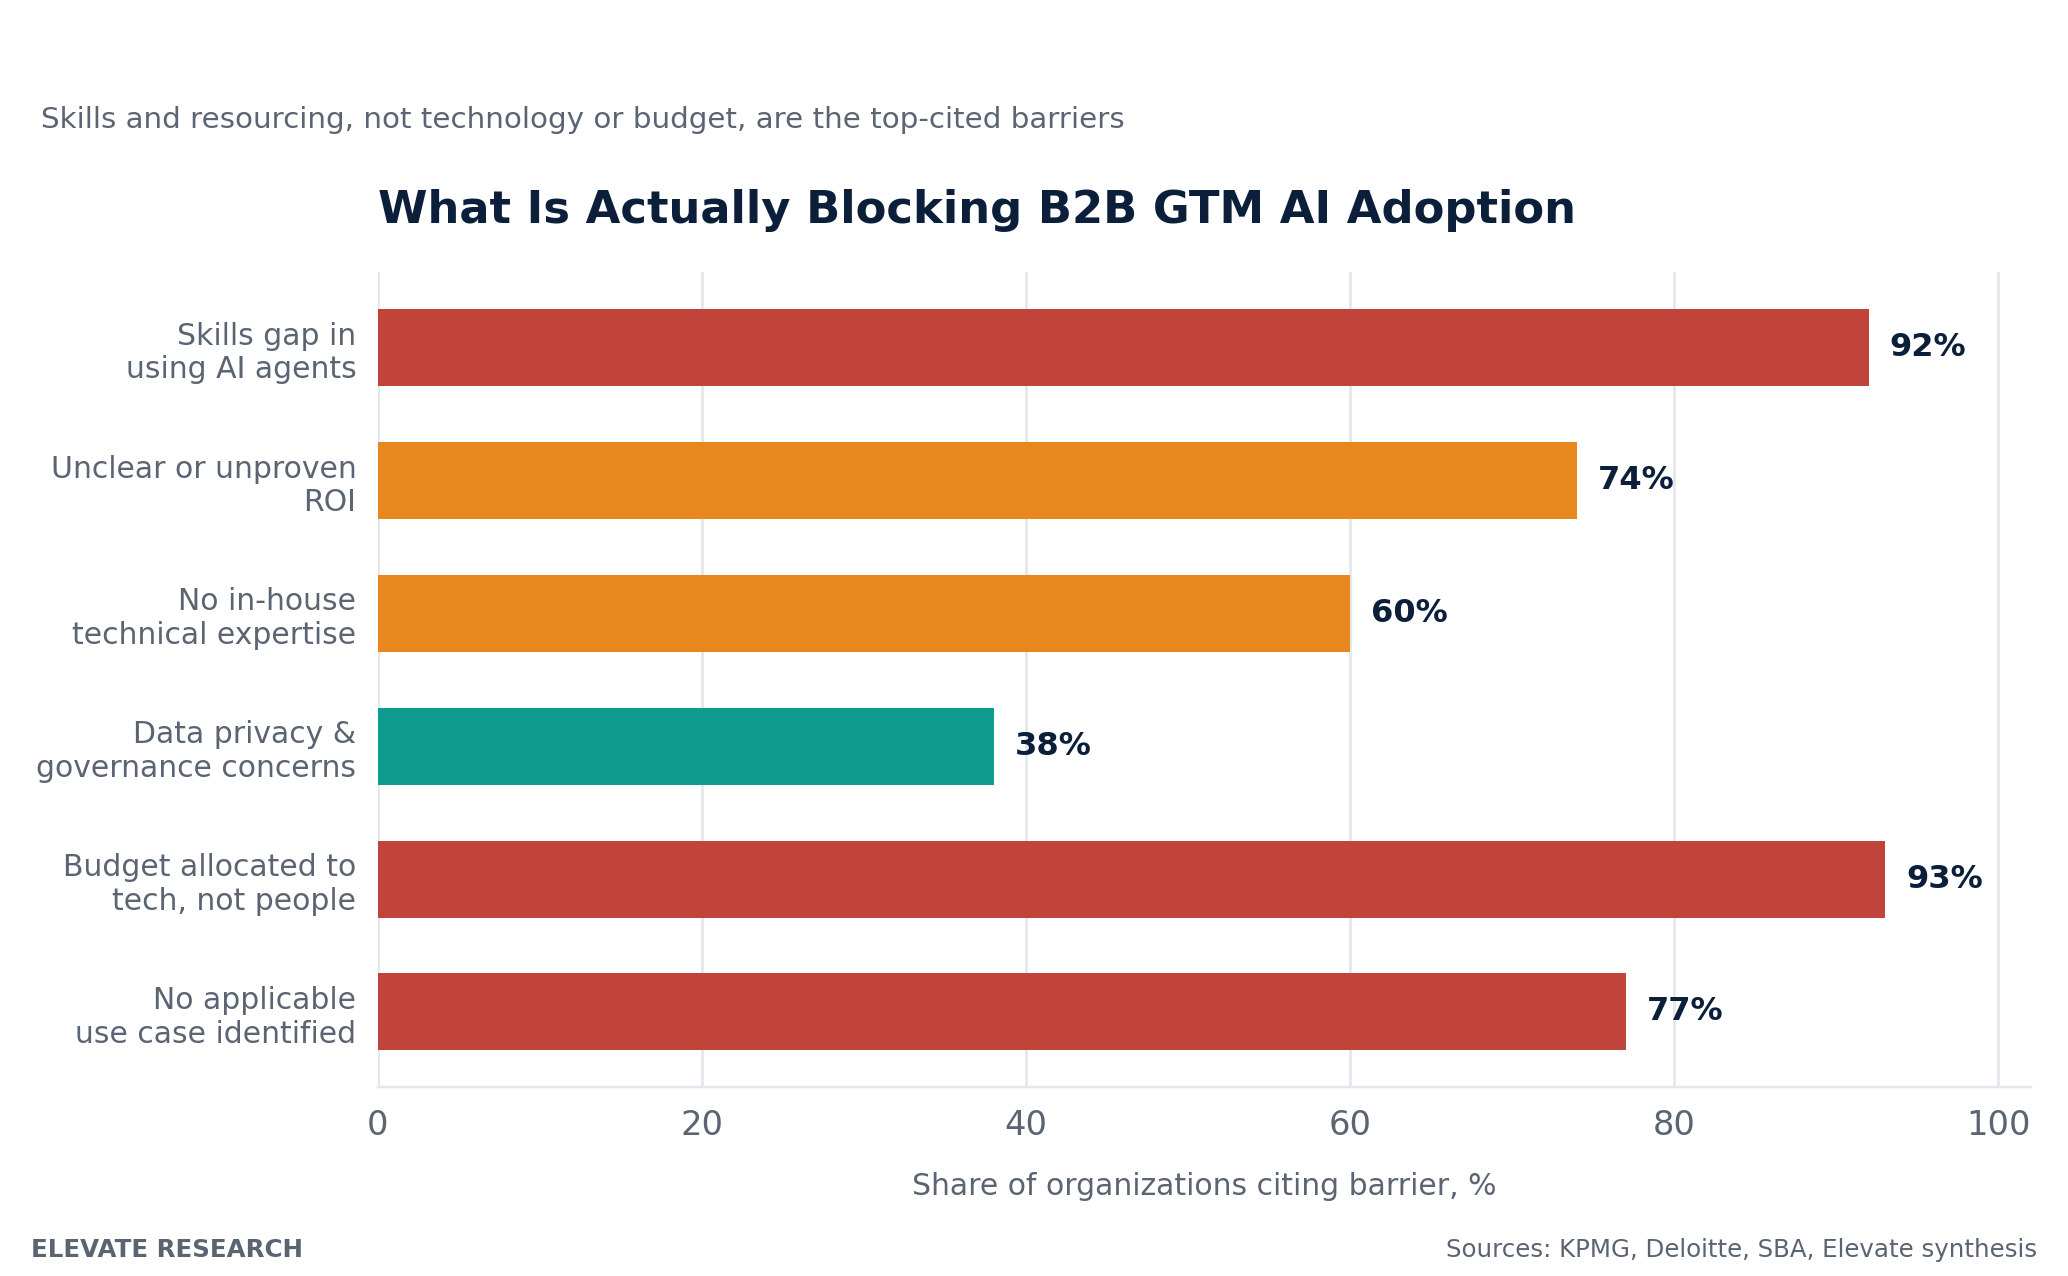 Figure 5. Share of organizations citing each barrier as a significant obstacle to AI adoption return on investment.
What the SMB adoption pattern reveals about sequencing at any company size
A further pattern Elevate's platform surfaced by cross-referencing SMB-specific adoption research against the enterprise-level maturity data in this report is that the sequencing lessons in this asset are not exclusively an enterprise concern. SMBs are adopting AI extremely quickly, but almost entirely within a single function, marketing and customer engagement, rather than across the broader functional footprint enterprise organizations are attempting to cover. This narrower footprint may look like a limitation, but Elevate's synthesis reads it as an accidental example of the sequencing discipline recommended throughout this report: concentrated, function-specific adoption with a clear, measurable use case tends to reach meaningful depth faster than broad, simultaneous deployment across many functions at once. Enterprise GTM organizations attempting to scale AI across marketing, sales, customer success, and revenue operations simultaneously may have more to learn from the SMB adoption pattern's narrow focus than from any enterprise-specific case study, even though the two segments differ enormously in resources and scale.
7. Strategic Recommendations
Elevate recommends five actions for GTM leaders using this asset's adoption data to plan their own 2027 AI investment. Each is designed to be actionable within a single planning cycle rather than requiring a multi-year transformation program to begin.
1. Stop benchmarking against adoption rate; start benchmarking against maturity stage
Given that basic AI adoption has become close to universal, comparing your organization's adoption rate against an industry average provides almost no useful signal. Replace that benchmark with a maturity-stage assessment, using a funnel similar to Figure 1, and identify honestly which stage your organization is actually operating at within each GTM function rather than at the organizational level alone.
2. Rebalance budget toward people, not just technology
With Deloitte's research showing a 93 to 7 split between technology and people investment as the norm, and KPMG identifying skills gaps as the top-cited barrier to return, GTM leaders should treat training, workflow redesign, and change management as a comparable line item to technology licensing, not an afterthought funded from whatever budget remains. In practice, this means building a people-investment line into every AI technology purchase decision from the outset, rather than treating enablement as a post-purchase cost to be minimized.
3. Fix revenue operations adoption before scaling customer-facing agents further
Since functional adoption gaps in revenue operations and pricing propagate forward into every customer-facing AI investment built on top of them, GTM leaders should treat revenue operations maturity as a gating factor for further customer-facing agent investment, not a parallel workstream that can be addressed later. Before approving the next customer-facing agent deployment, GTM leaders should ask a specific diagnostic question: does this agent depend on pricing, pipeline, or customer data that revenue operations has not yet unified or governed, and if so, is that dependency the actual reason a previous agent deployment underperformed.
4. Build governance maturity deliberately, not reactively
With average responsible AI maturity sitting at 2.3 out of 4 across the organizations studied in the sources reviewed for this report, and with governance gaps directly implicated in the 88 percent pilot failure rate identified by IDC, governance investment should be sequenced alongside, not after, scaled deployment, consistent with the governance-first recommendation introduced in Asset 1 of this series.
5. Treat regional and functional variance as planning inputs, not noise
With adoption maturity varying meaningfully by region and function, as shown by Deloitte's India findings and the functional adoption data in this report, global GTM organizations should build differentiated maturity targets by market and function rather than applying a single global AI adoption target across a genuinely uneven organization.
ELEVATE PERSPECTIVE Every recommendation in this section points toward the same underlying discipline: measure honestly before investing further. The organizations most likely to close the investment-impact gap described throughout this report are not the ones deploying AI fastest. They are the ones willing to admit, function by function, exactly where they actually sit on the maturity funnel before deciding where the next dollar of AI investment should go.
8. Executive Takeaways
- Adoption has stopped being the differentiator: 88 percent of organizations use AI in at least one function, but only about 1 percent have a mature AI strategy, meaning maturity, not adoption, is the real competitive gap.
- The investment-impact gap is large and quantified: 95 percent of enterprise AI pilots deliver no measurable profit and loss impact, even as AI investment has grown to roughly 1.7 percent of revenue at the median company.
- Revenue operations lags customer-facing functions: Scaled AI deployment is strongest in customer service, marketing, and sales, and weakest in the connective, data-centric functions like revenue operations that those customer-facing functions depend on.
- The barriers are people problems, not technology problems: 92 percent of technology leaders cite skills gaps as the top barrier to AI ROI, while 93 percent of AI budgets go to technology versus 7 percent to people.
- Company size still matters, but less than it used to: The basic adoption gap between large and small businesses has narrowed sharply, even as the scaled, agentic deployment gap between enterprise and SMB organizations remains wide.
- Buyers are still ahead of sellers: 89 percent of B2B buyers already use generative AI in their research process, a rate roughly three times faster than consumer market adoption, reinforcing the buyer-seller asymmetry identified in Asset 2 of this series.
9. Future Outlook
Based on the adoption patterns synthesized in this report, Elevate expects the next 18 to 24 months to bring three specific shifts in how B2B GTM organizations approach AI adoption.
First, adoption reporting itself will shift away from simple usage percentages and toward maturity-stage and function-level detail, as the shallow, any-use adoption figures that dominated 2024 and 2025 coverage lose their usefulness once nearly every organization clears that threshold. Analyst firms and internal GTM leadership alike will increasingly need funnel-style reporting, similar to Figure 1 in this report, to communicate adoption progress meaningfully to boards and investment committees who have grown appropriately skeptical of headline adoption statistics.
Second, the talent and governance investment currently lagging technology investment by a wide margin will begin correcting, driven less by voluntary best practice and more by the accumulating evidence that technology-only investment is not converting to results. Organizations that made this correction early, evidenced by Deloitte's India findings and by the small minority of organizations BCG and McKinsey identify as genuinely mature, will have a multi-year head start over organizations that wait for board pressure to force the rebalancing.
Third, the functional adoption gap between customer-facing GTM functions and revenue operations is likely to narrow, not because revenue operations receives dramatically more investment on its own, but because the compounding risk identified in Section 6 of this report, that weak revenue operations data undermines the return on customer-facing AI investment, becomes visible enough in commercial results that organizations are forced to address the upstream constraint in order to protect the return on investment they have already made downstream.
Fourth, the definitional inconsistency across adoption surveys identified in Section 4 of this report is likely to prompt a period of standardization, as boards and investors, having been burned by inflated any-use adoption figures that did not correspond to commercial results, begin demanding the kind of maturity-stage and function-level detail this report advocates for rather than accepting a single headline adoption percentage at face value. Organizations that build internal reporting on this more granular basis now will be better positioned to answer that scrutiny credibly when it arrives, rather than scrambling to reconstruct a more honest picture after a board or investor has already lost confidence in a previously reported adoption figure.
The organizations that read this report's adoption data correctly will treat the 88 percent adoption figure as the least useful number in this asset, and the 1 percent maturity figure as the most useful one. Subsequent assets in this series examine specific dimensions of the maturity gap identified here in more depth, including GTM technology landscape mapping, AI agents in revenue organizations, and GTM maturity benchmarking more broadly.
10. References
- McKinsey and Company. State of AI research series, including organizational adoption, scaling, and maturity findings. McKinsey Global Survey, 2025 to 2026.
- BCG and MIT. Joint research on enterprise AI pilot outcomes and profit and loss impact, commonly referenced as the MIT GenAI Divide research. 2026.
- Deloitte. State of AI in the Enterprise report, including global and India-specific functional adoption findings. Deloitte AI Institute, 2026.
- KPMG. Quarterly AI Pulse Survey, including skills gap and AI budget allocation findings. KPMG Research, Q1 and Q4 2025 to 2026.
- IDC. Research on AI pilot-to-production failure rates and associated governance and data-readiness gaps. IDC Research, 2026.
- Gartner. CMO Spend Survey and enterprise application agent adoption forecasts, cross-referenced with Asset 1 of this series. Gartner Research, 2025 to 2026.
- U.S. Census Bureau. Business Trends and Outlook Survey, AI production-use statistics by business size. U.S. Census Bureau and SBA Office of Advocacy, 2025 to 2026.
- Forrester. Buyers Journey Survey and B2B generative AI adoption research. Forrester Research, 2024 to 2026.
- Intuit, Salesforce, and Thryv. SMB AI adoption survey programs, compiled and cross-referenced for this report. 2024 to 2026.
- Elevate Research. AI Adoption Maturity Funnel and functional adoption synthesis, proprietary frameworks derived from Elevate's pattern intelligence synthesis of the sources cited above. Elevate Research, 2026.
Contents
Related Research
GTM Research
Explore research, benchmarks, technology landscapes, and perspectives on the evolution of go-to-market.
View Research Library →