
AI Agents in Revenue Organizations
A working taxonomy of the AI agents now operating inside B2B revenue teams, what they actually cost per task, how their ROI compounds, and how org design is changing as a result.
Published 2026-08-01
1. Executive Summary
The first four assets in this series established the macro picture: AI-native GTM spend is accelerating, buyer behavior is shifting toward agent intermediation, adoption has outpaced maturity, and the technology landscape is consolidating around AI-native platforms. This asset zooms into the unit of work itself: what an AI agent inside a revenue organization actually does, what it costs, and what it replaces or augments.
The most important framing correction the research synthesized here makes is that "AI agent" is not a single thing. A revenue organization deploying agents in 2026 is typically deploying a taxonomy of narrow, task-specific agents, lead enrichment agents, prospecting agents, meeting prep agents, sales coach agents, forecasting agents, and customer success agents, rather than one general-purpose assistant. This is consistent with the shift toward vertical, task-specialized agents identified in Asset 2 of this series, now visible at the level of individual agent deployments rather than as an abstract trend.
The economics behind this shift are stark and increasingly well documented. Forrester's Total Economic Impact studies and comparable research find that AI agents resolve a contained customer service ticket for 46 cents versus 4.18 dollars for human-handled resolution, a 9x cost advantage, while routine code review tasks show cost gaps as large as 66x. Gartner's own 2026 survey data shows only 17 percent of organizations have deployed AI agents to date, even as more than 60 percent expect to do so within two years, the most aggressive adoption curve Gartner tracks among any emerging technology category. Read alongside the cost data, this combination explains why agent deployment is accelerating even as the maturity gap identified in Asset 3 of this series remains wide: the economic case is compelling enough that organizations are moving before governance and workflow redesign have fully caught up.
For revenue leaders, this asset's practical contribution is a working taxonomy and cost framework that can inform which agents to deploy first, how to budget for them realistically, including the oversight and failure-recovery costs that most agent budgets underestimate, and how org design itself is beginning to shift in response.
The sections that follow build this framework in stages. Section 3 establishes the current scale and shape of agent deployment inside revenue organizations. Section 4 details six trends explaining how agents are actually being built, deployed, and governed in production. Section 5 compares how Gartner, Forrester, and Bain each frame the risk and opportunity in this fast-moving category. Section 6 presents Elevate's own synthesis, including a proprietary taxonomy of agent types across the revenue funnel and a fully loaded cost framework. Sections 7 through 9 translate that analysis into deployment recommendations, executive takeaways, and a forward view of how agent-driven org design is likely to standardize over the next two years.
2. Research Methodology
This asset follows the same Elevate research asset formula used throughout this series: analyst research, public data, proprietary analysis, and Elevate perspective, applied consistently for comparability across all 30 assets.
Sources synthesized
This report draws on Gartner's 2026 Hype Cycle for Agentic AI and CIO Technology Executive Survey, Forrester Total Economic Impact studies on AI agent cost per task, McKinsey Global AI Survey and Slack Workforce Index productivity data, Bain's Agentic AI Benchmark research on payback periods, field reporting and case data from GTM platform vendors including Outreach, and independent AI agent cost and economics research compiled from production deployment data across customer service, engineering, and sales development use cases.
How Elevate adds value
Agent-level cost and ROI research is unusually susceptible to a specific distortion: figures quoted from vendor case studies or marketing material frequently describe only the visible cost of model inference, omitting the build, oversight, failure-recovery, and compliance costs that determine whether an agent deployment is economically sustainable at scale. Elevate's research platform uses a large language model, OpenAI's models, as its reasoning and synthesis engine, paired with a pattern intelligence layer built specifically to distinguish headline cost-per-task figures from fully loaded cost figures that include these additional cost buckets, rather than treating every published number as directly comparable.
Where this report cites a cost or ROI figure, it notes whether the figure reflects narrow inference cost or a more fully loaded estimate, and where a single illustrative case study is used, such as the org restructuring example in Section 6, it is explicitly labeled as an individual reported case rather than a representative average. Every Elevate Perspective in this report reflects a pattern that recurs across multiple independent sources, not a single vendor's claim.
3. Current Market Landscape
The AI agent market itself has grown from a niche category into a substantial, fast-growing segment within the broader AI GTM technology spend described in Asset 1 of this series. The global AI agents market is estimated at approximately 10.9 billion dollars in 2026, up from 7.6 billion dollars in 2025, and is projected to reach roughly 50.3 billion dollars by 2030 at a compound annual growth rate near 46 percent. Within revenue organizations specifically, an estimated 51 percent of enterprises report having AI agents in production as of 2026, with another 23 percent actively scaling deployment, though these figures should be read alongside the more conservative 17 percent figure from Gartner's CIO survey, a gap that likely reflects differing definitions of production deployment consistent with the measurement inconsistency identified in Asset 3 of this series.
Within revenue organizations specifically, agent deployment has concentrated most heavily at the top of the funnel, in prospecting and sales development, where the task structure is most conducive to current agent capability: high volume, clearly defined success criteria, and short feedback loops. Field reporting from platform vendors including Outreach describes production deployments running specific, bounded motions, such as a win-back campaign against closed-lost accounts that had gone unworked because human sellers lacked bandwidth, rather than open-ended, fully autonomous sales development. This pattern, narrow and bounded rather than broad and autonomous, recurs consistently enough across the sources reviewed for this report that it should be read as the current default shape of production agent deployment in revenue organizations, not an exception.
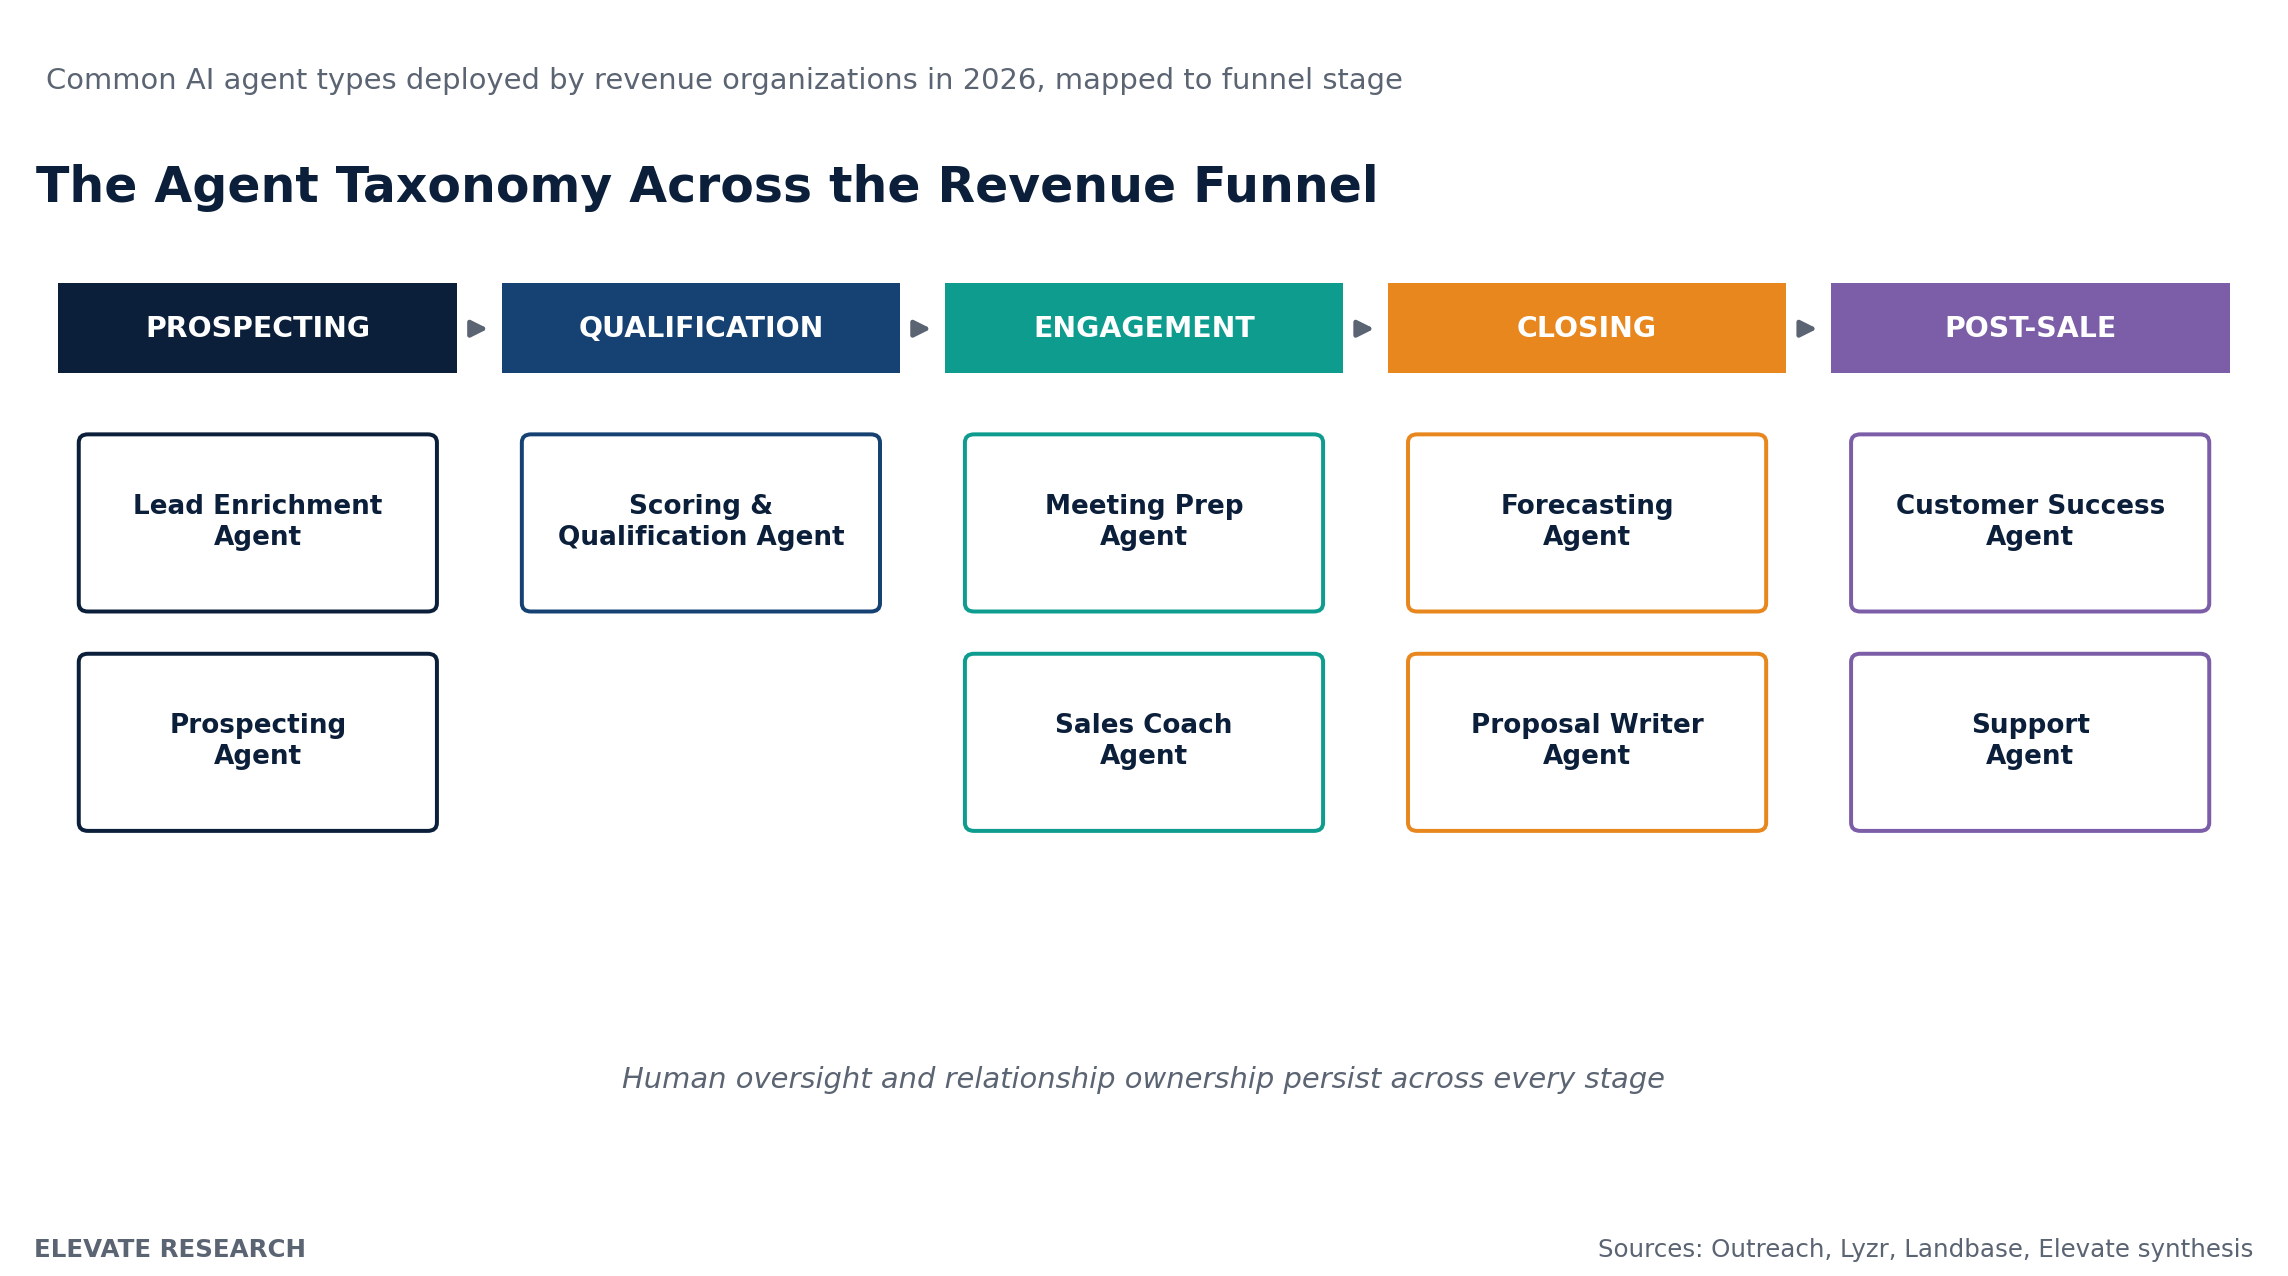 Figure 1. Common AI agent types deployed by revenue organizations in 2026, mapped to funnel stage. Human oversight and relationship ownership persist across every stage.
The taxonomy in Figure 1 is deliberately drawn from production deployment patterns rather than vendor marketing category names, since the same underlying agent function is frequently marketed under different names by different vendors. A lead enrichment agent from one vendor and a data validation agent from another are, functionally, performing the same narrow task: keeping account and contact records current and complete enough for downstream agents and human sellers to act on. Reading the vendor landscape through this functional taxonomy, rather than through vendor-specific product names, is a more reliable way for a GTM buying committee to compare deployment options across the fragmented vendor set described in Asset 4 of this series.
Gartner's 2026 Hype Cycle for Agentic AI places the category at the Peak of Inflated Expectations, reflecting extraordinary market attention alongside genuinely uneven underlying maturity. Gartner's own assessment is that most current deployments remain narrowly scoped, concentrated in software engineering, customer support, and operations, and that fully autonomous agents are not yet ready for the majority of enterprise use cases without meaningful human oversight. This assessment is directly consistent with the governance findings in Asset 1 of this series and provides additional texture to why Gartner separately forecasts that more than 40 percent of agentic AI projects remain at risk of cancellation.
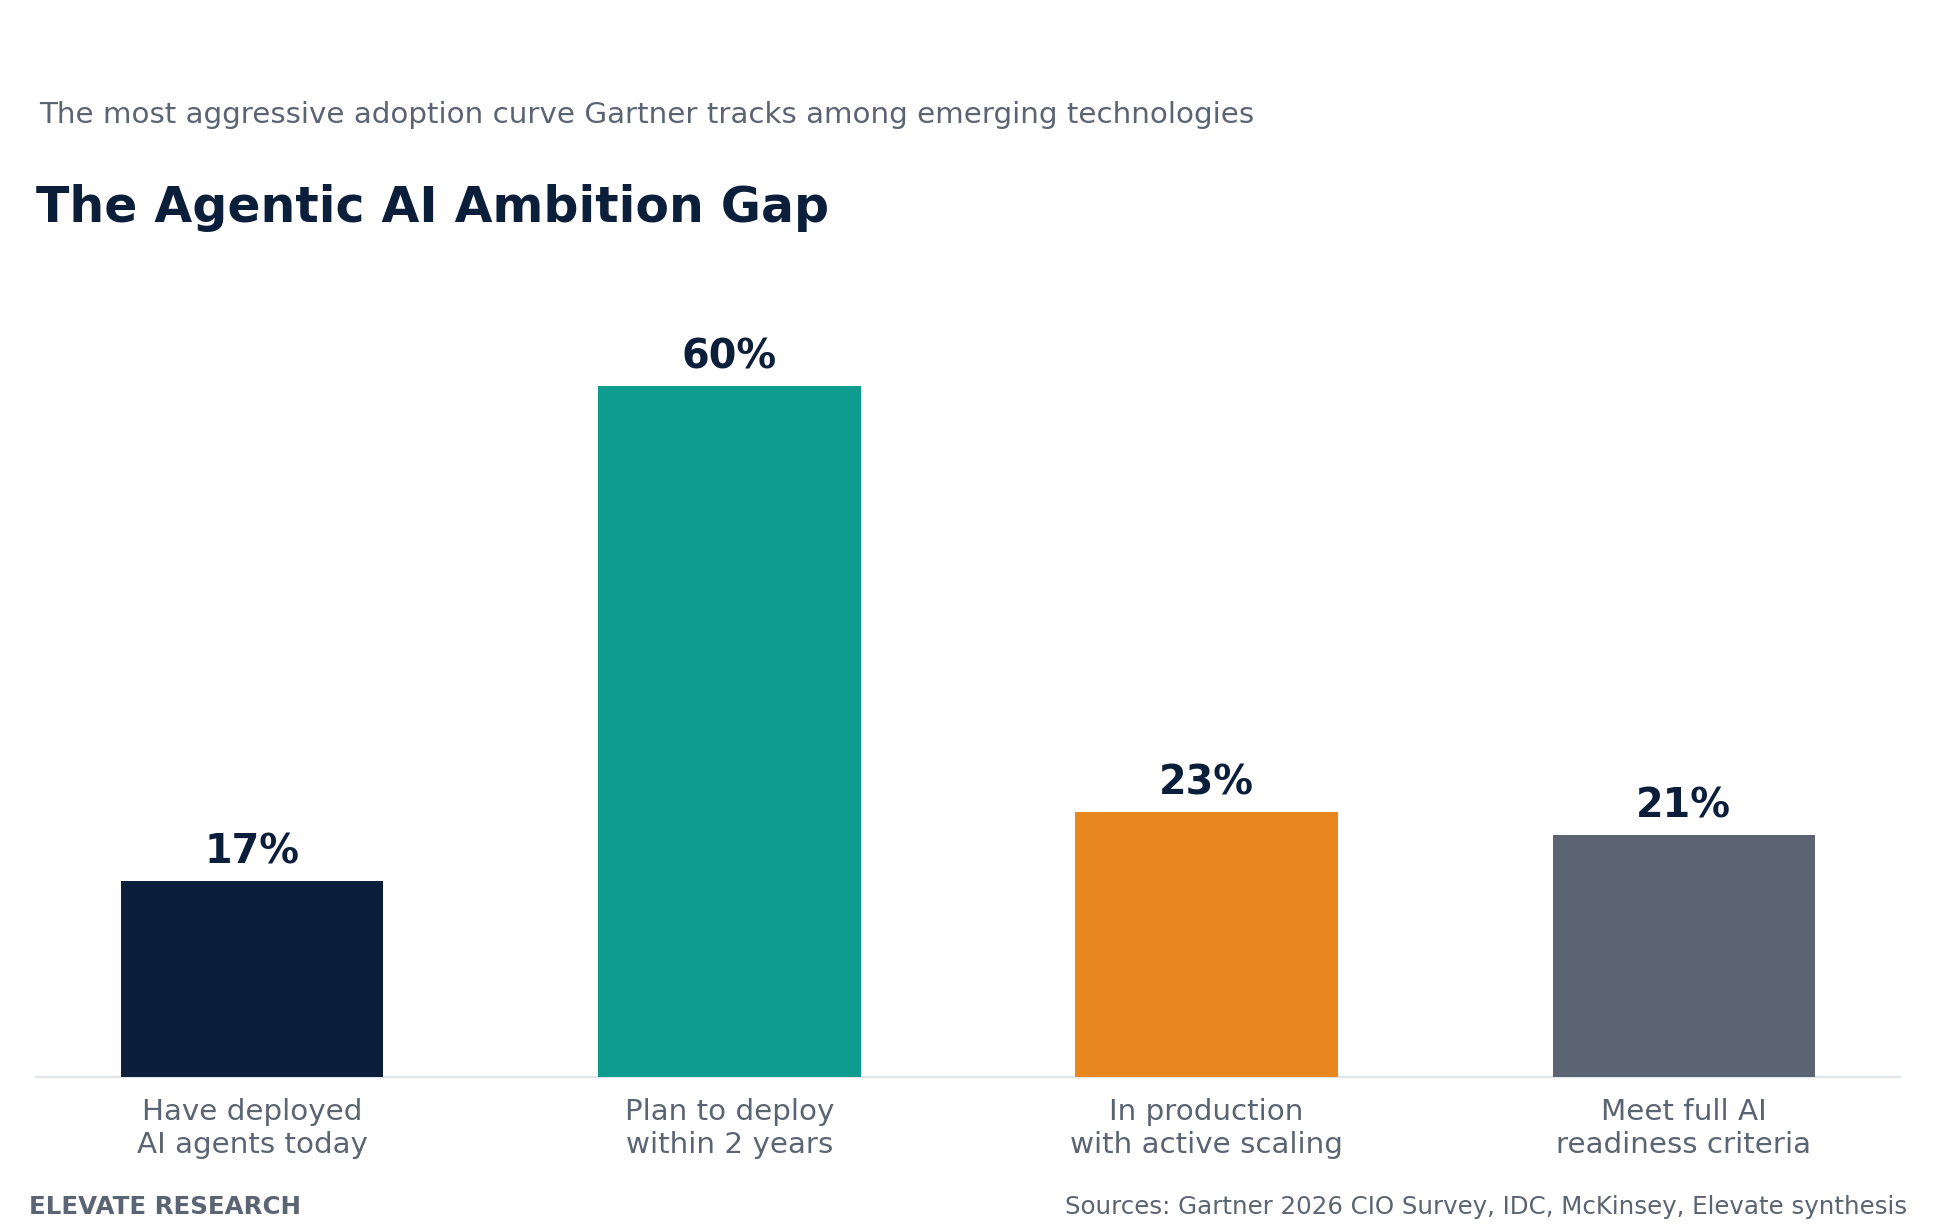 Figure 2. The gap between current AI agent deployment and near-term deployment intent, alongside broader AI agent readiness measures.
17% of organizations have deployed AI agents as of Gartner's 2026 survey, while more than 60 percent expect to do so within two years, the most aggressive adoption curve Gartner tracks among any emerging technology. Source: Gartner 2026 CIO and Technology Executive Survey
4. Key Trends
Six trends define how AI agents are actually being deployed inside B2B revenue organizations in 2026.
1. The "fully autonomous AI SDR" narrative has given way to orchestration
Industry commentary that was bullish on fully autonomous AI sales development as recently as 2023 and 2024 has shifted decisively by 2026: production evidence has disproven the thesis that a language model with access to a calendar and inbox can independently replace a human business development representative. What has emerged instead is an orchestration model, multi-agent systems that research accounts, score intent signals, draft sequences, and handle initial replies, operating under human-designed guardrails, RevOps process design, and compliance management rather than fully independent of it. Vendors themselves have converged on this same framing: the winning product category is increasingly described as an orchestration engine that sits on top of the existing CRM, sales engagement platform, and data providers, not a standalone replacement for any of them.
2. Multi-agent systems consistently outperform single-agent deployments
Reporting on multi-agent AI SDR systems finds that outbound opportunity rates commonly double or triple when organizations move from a single generalist AI tool to a coordinated system of specialized agents, each handling a distinct task such as strategy, research, or personalization, then handing off to the next agent in the sequence. This is the clearest available field evidence for the vertical, task-specialized agent trend identified in Asset 2 of this series, now observed as a direct performance driver rather than only an architectural preference.
3. Cost-per-task advantages are largest for routine, structured work and narrow for judgment-heavy work
Cost comparisons across task types show AI agent cost advantages ranging from roughly 9x on contained customer service resolution to as much as 66x on routine code review tasks, but the advantage narrows sharply on judgment-heavy work such as legal, clinical, or complex financial advisory tasks, where mandatory human review re-adds human cost regardless of how inexpensive the underlying model becomes. This pattern is directly consistent with the automation exposure findings in Asset 2 of this series, now quantified in cost terms rather than only in task-exposure terms.
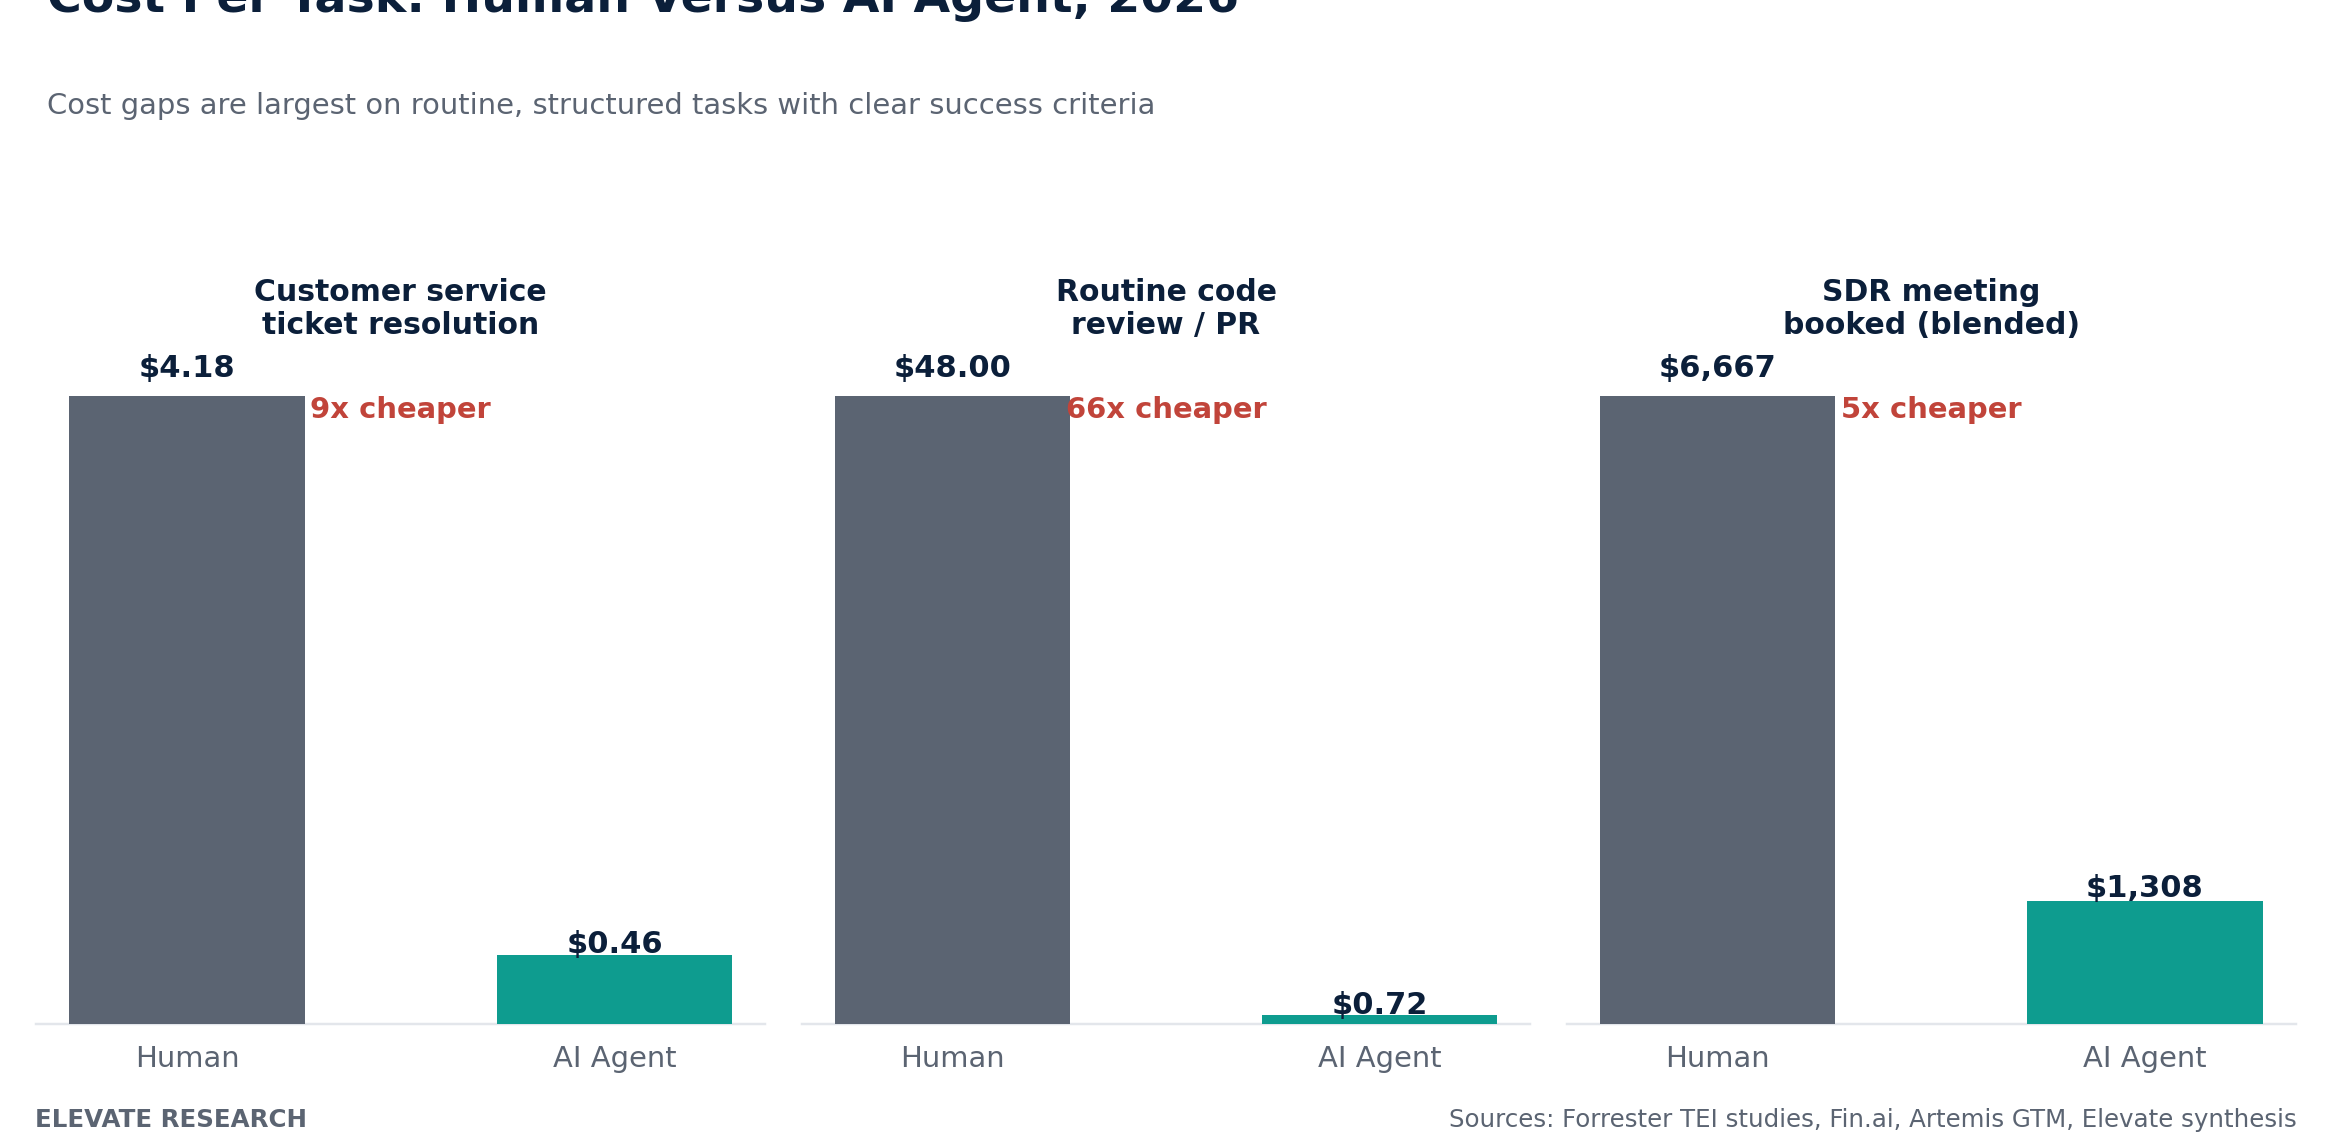 Figure 3. Cost per completed task, human versus AI agent, across three representative task types.
4. Failure rate and oversight cost, not inference cost, determine real economic viability
Production cost research finds that early agent deployments typically achieve only around 50 percent autonomous resolution, with mature systems reaching 70 to 80 percent, and that the remaining failure share consumes disproportionate resources through retries, escalations, and senior staff intervention. This means the true cost of an agent deployment is better modeled as inference cost divided by success rate, not inference cost alone, a distinction this report's methodology section addresses directly and one that most published agent cost comparisons omit.
5. Governance and evaluation infrastructure is becoming a larger share of total agent program budget
Forecasting reviewed for this report projects that evaluation and governance spend will grow from roughly 18 to 24 percent of total agent program budget today to 28 to 34 percent by mid-2027, driven by hardening audit requirements under emerging AI regulation in the US, EU, and UK. This is a direct, budget-level confirmation of the governance-first sequencing recommendation introduced in Asset 1 of this series, now with a specific forecast trajectory attached.
6. ROI compounds meaningfully over time, rewarding organizations that stay the course past year one
Return on investment research on AI customer service agents, illustrative of the broader ROI compounding pattern observed across agent deployments, shows returns averaging 41 percent in year one, climbing to 87 percent in year two, and exceeding 124 percent by year three. This compounding pattern is consistent with the workflow redesign argument from Asset 3 of this series: organizations that treat agent deployment as a one-time tooling purchase rather than an ongoing optimization process are the ones most likely to abandon a deployment before the compounding returns materialize.
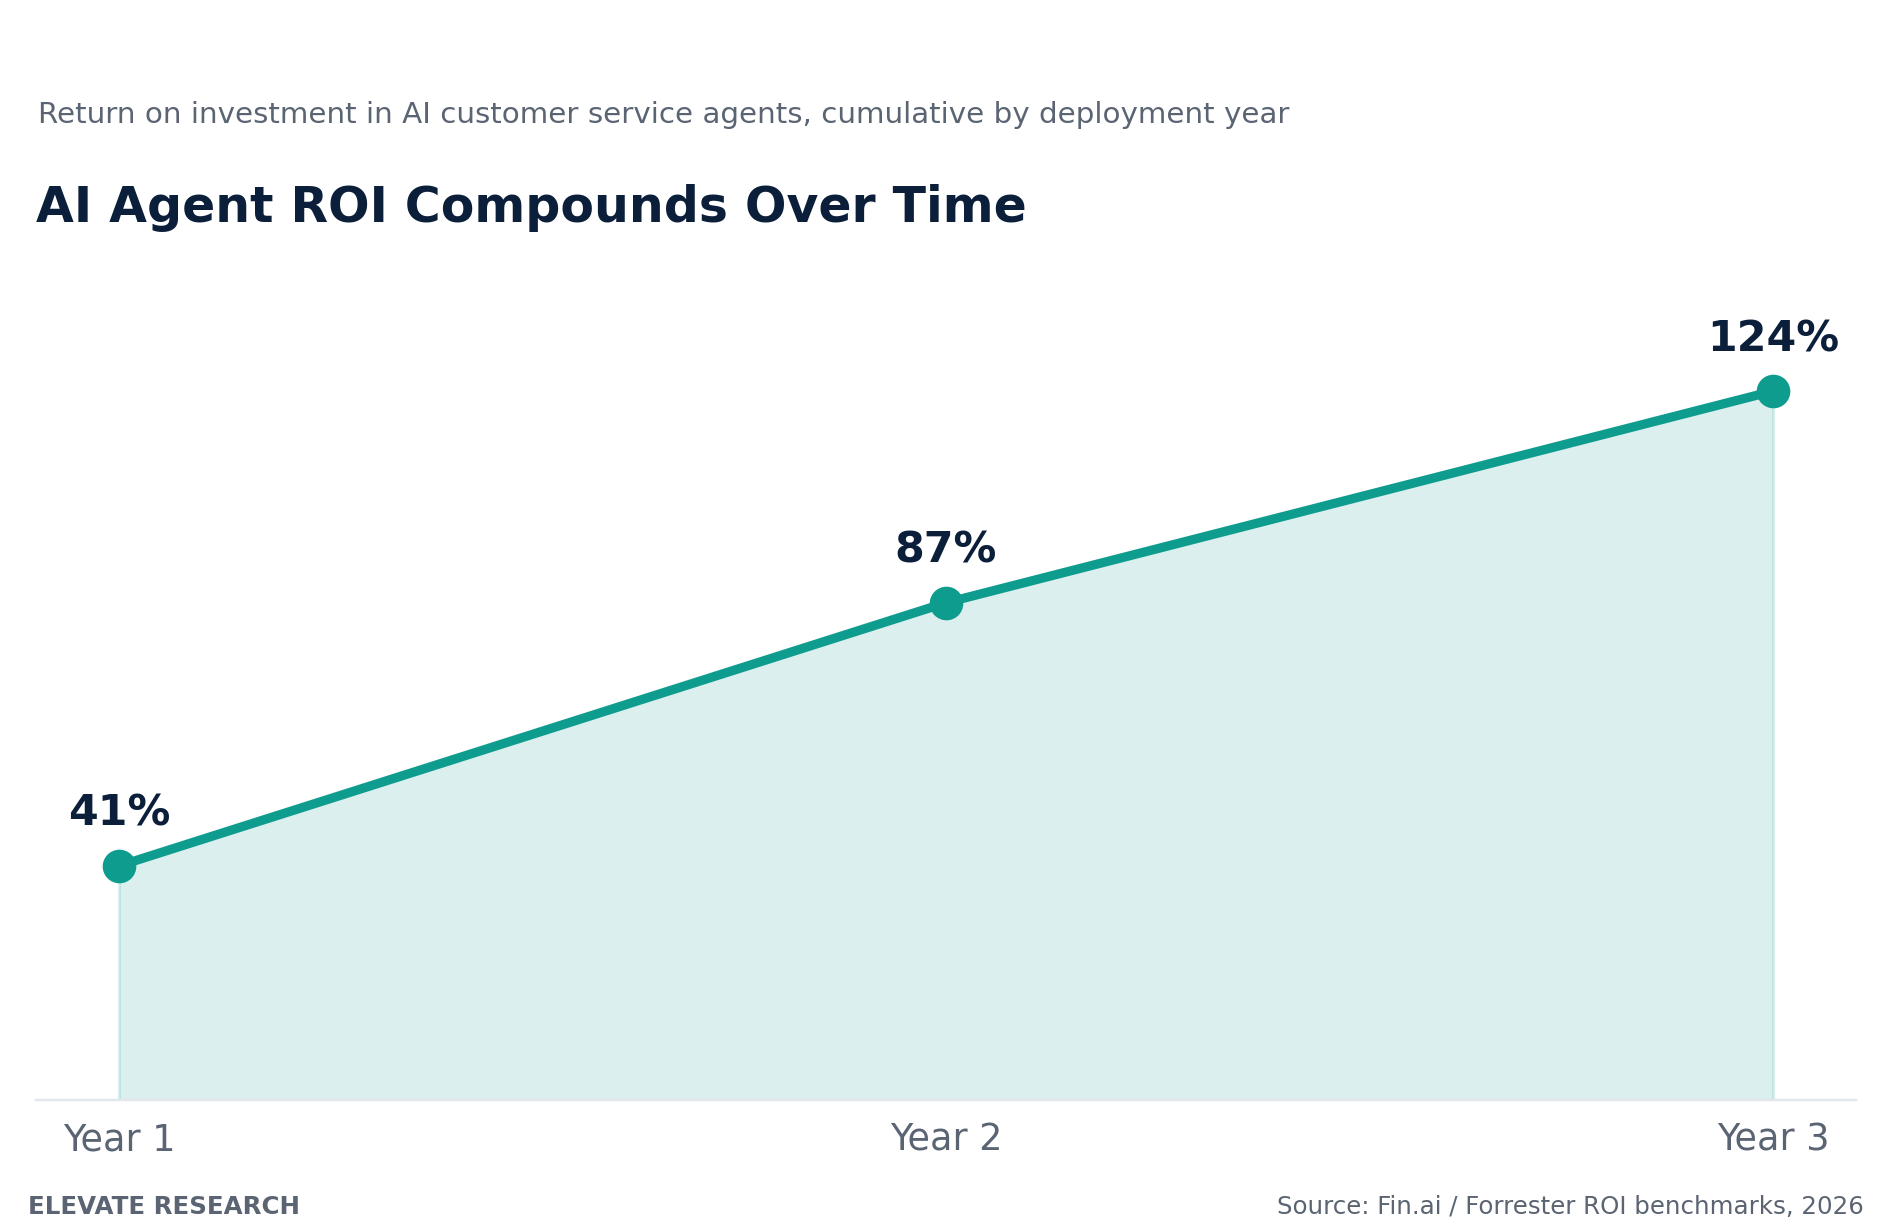 Figure 4. Cumulative return on investment for AI customer service agents by deployment year.
7. Voice and multimodal agents are the next capability frontier, not yet the current default
Industry forecasting reviewed for this report expects AI agents capable of making outbound calls, leaving voicemails, and handling inbound phone qualification to move from pilot to production between the second half of 2026 and mid-2027, alongside a broader shift toward vertical, industry-specific agents trained on domain-specific language, personas, and compliance requirements rather than generic, horizontal agent products. Revenue leaders evaluating agent vendors today should treat voice and multimodal capability as a near-term roadmap item to track rather than a current deployment requirement, since the sources reviewed for this report consistently place production-grade voice agent capability roughly twelve to eighteen months behind the text and data-based agent capability that dominates current deployments.
5. Analyst Perspectives
The major sources reviewed for this report converge on the shape of agent deployment while emphasizing different risk factors.
Gartner's Hype Cycle placement of agentic AI at the Peak of Inflated Expectations is itself a form of analyst perspective worth reading carefully: Gartner explicitly frames the wide gap between adoption ambition, more than 60 percent planning deployment within two years, and current execution, only 17 percent deployed today, as evidence of genuine risk rather than simply a normal technology adoption curve. Gartner's parallel emphasis on governance, security, and cost-focused profiles appearing early and independently across the Hype Cycle, rather than clustered with core agentic AI technology profiles, signals that Gartner views oversight infrastructure as a precondition for responsible scaling, not an afterthought to be addressed once agents are already in production.
Forrester's Total Economic Impact research contributes the most granular, task-level cost evidence available in this asset's source base, and its framing carries an implicit warning worth making explicit: cost-per-task figures this favorable create strong organizational incentive to scale deployment quickly, which is precisely the dynamic that produces the governance and oversight gap Gartner's research warns about. The two firms' research, read together, describes a coherent risk: the economics of agent deployment are compelling enough to outpace the governance investment needed to deploy them safely, unless organizations deliberately slow down to build that governance capacity in parallel.
Bain's Agentic AI Benchmark research adds a practically useful data point for planning purposes: median payback periods across agent deployments run from 4.1 months for customer service to 9.3 months for engineering use cases, with vendor-deployed agents reaching positive return on investment 2.4 times faster than internally built equivalents. This finding has direct relevance to the build versus buy question raised in Asset 4 of this series, suggesting that for most revenue organizations without deep in-house AI engineering capability, vendor-deployed agents remain the faster path to positive return even accounting for the platform fees such deployments typically carry.
Reading Gartner, Forrester, and Bain's perspectives together surfaces a useful division of concern that maps onto the recommendations this report builds toward in Section 7. Gartner's research is most useful for calibrating deployment ambition against organizational governance readiness. Forrester's research is most useful for building an honest, task-level cost case for a specific deployment. Bain's research is most useful for sequencing decisions about build versus buy and for setting realistic payback expectations by function. No single firm's research answers all three questions on its own, which is precisely the kind of gap Elevate's synthesis in the next section is designed to close.
6. Elevate Analysis
The individual data points reviewed above describe agents at the level of cost, deployment rate, and category. What they do not directly address is what a functioning revenue organization actually looks like once agents are genuinely embedded in its operating rhythm. Elevate's synthesis is built around that translation.
The market trend: agent deployment is narrow and bounded, not broad and autonomous
Across every source reviewed for this report, the pattern is consistent: the agent deployments actually working in production are narrowly scoped to a specific, well-defined task with clear success criteria, not broad, autonomous replacements for an entire role. The SolarWinds win-back campaign example, where agents worked a previously unworked segment of closed-lost accounts rather than the full active pipeline, is representative of this pattern rather than an exception.
ELEVATE PERSPECTIVE This reframes how revenue leaders should scope their first agent deployments. The instinct to deploy a single, broad agent intended to replace an entire SDR function is the pattern most likely to fail, consistent with the "fully autonomous AI SDR" narrative that industry commentary has already disproven in production. The pattern most likely to succeed is the opposite: identify a specific, currently under-resourced or unworked segment of revenue motion, such as closed-lost win-back or long-tail account research, deploy a narrow agent against that specific motion, and expand scope only once that narrow deployment has demonstrated a measurable, positive return.
Why the org restructuring pattern is more nuanced than headcount reduction alone
Field-reported examples of GTM org restructuring around AI agents, while illustrative rather than statistically representative, consistently show a pattern worth naming precisely: the restructured team is not simply a smaller version of the prior team, it is a differently composed team, with a small number of retained humans shifting from task execution to agent supervision and exception handling, supported by a larger number of narrow, task-specific agents. This is the GTM-specific instance of the broader workforce redesign pattern identified in Asset 2 of this series, now visible in a concrete before-and-after example rather than only as an abstract forecast.
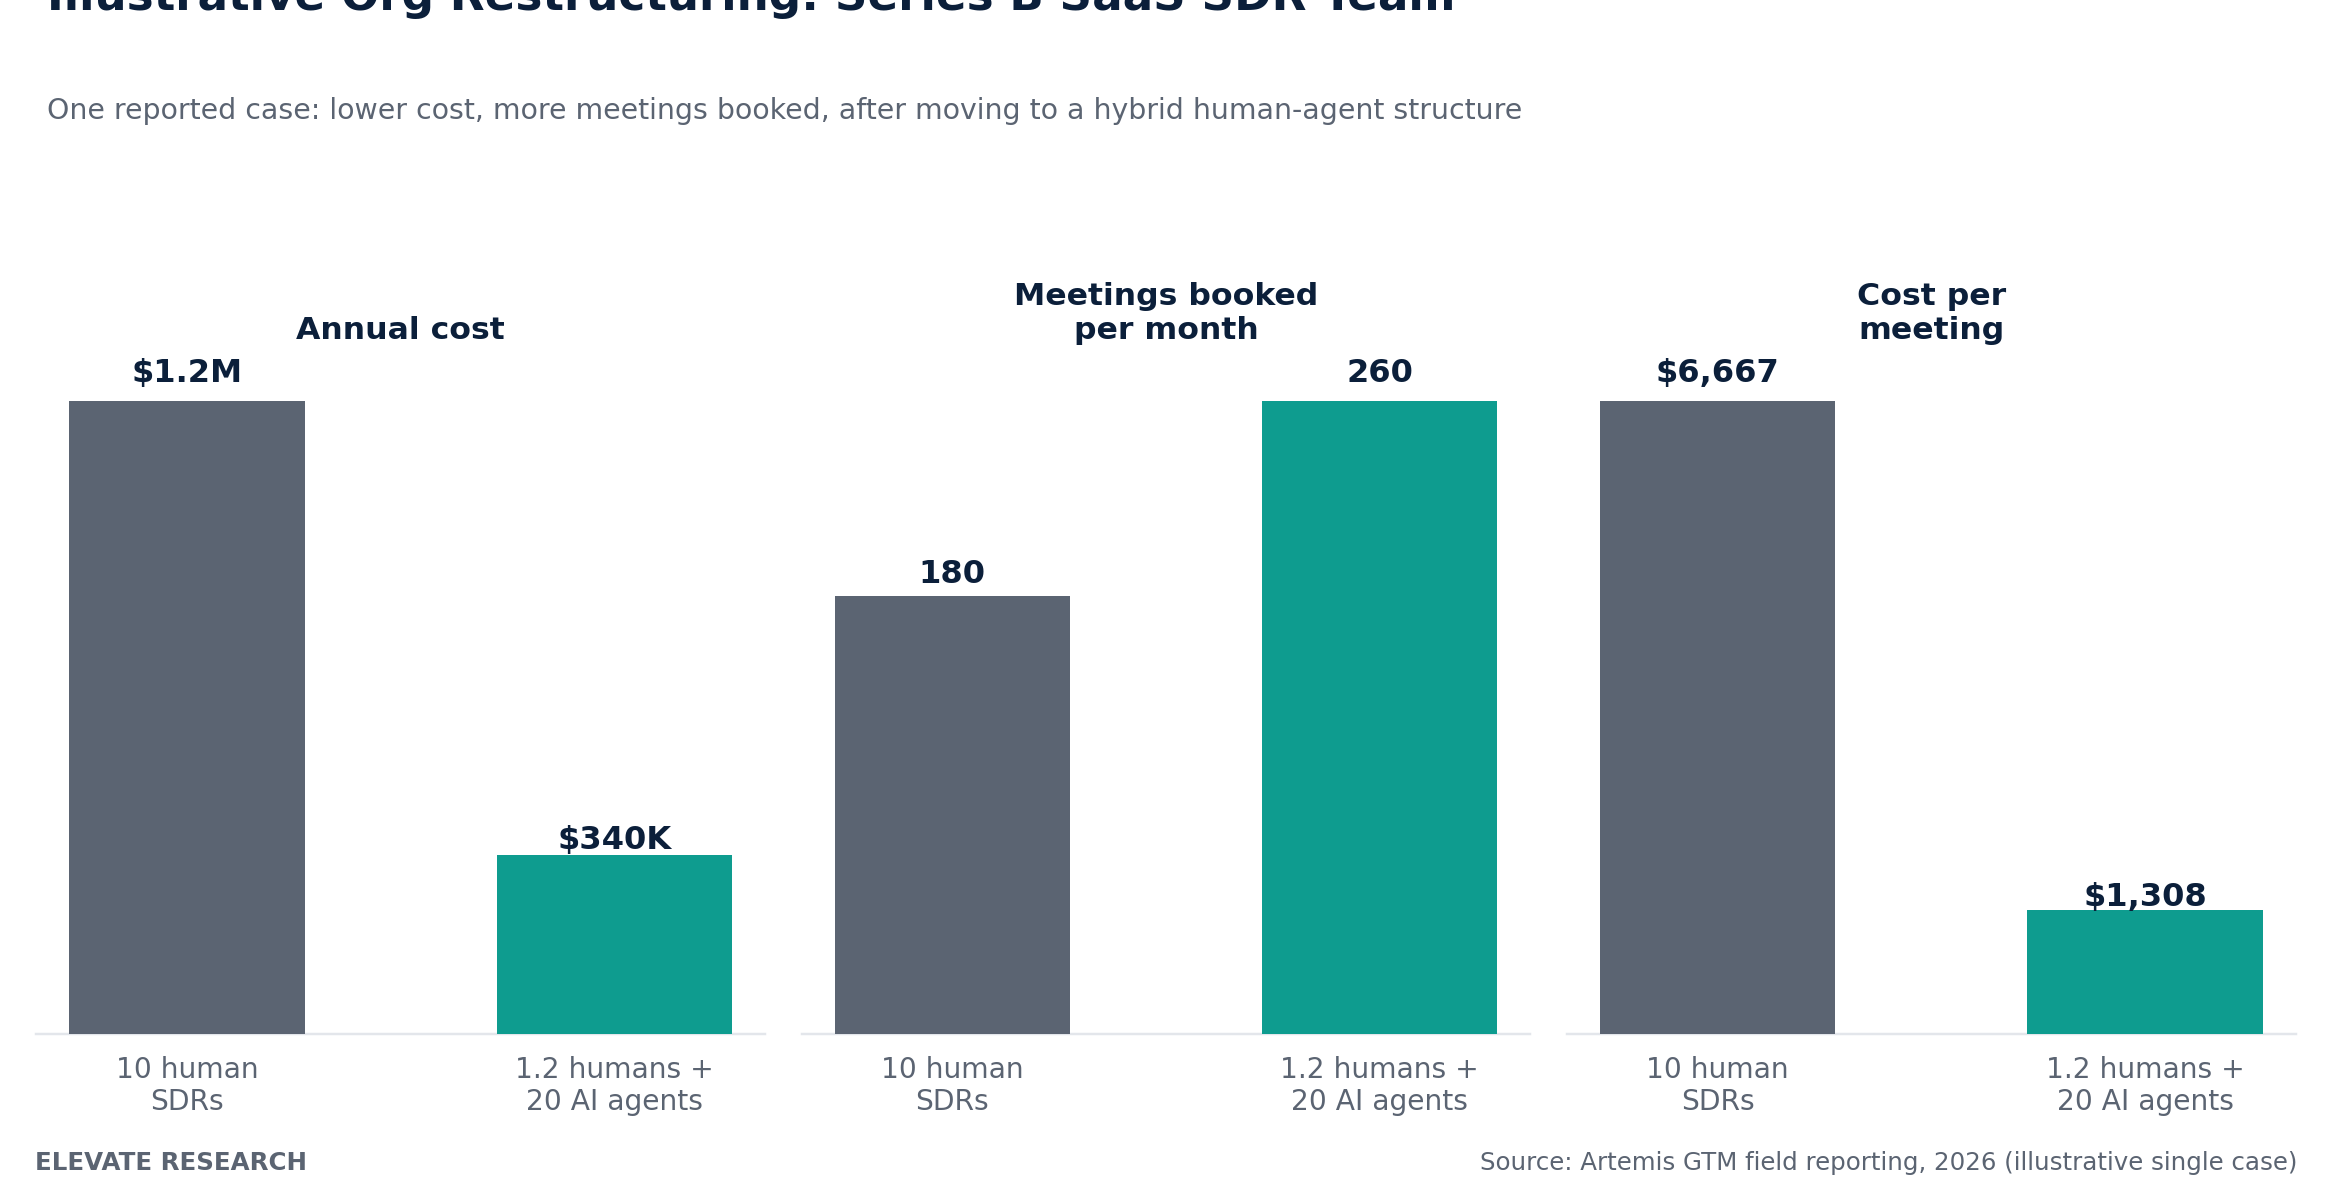 Figure 5. One reported case of SDR team restructuring around a hybrid human-agent model. Illustrative of a broader pattern, not a representative average.
Why the fully loaded cost model changes which agent deployments actually pencil out
Elevate's pattern intelligence synthesis of the cost research in this report surfaces a planning risk that recurs across the sources reviewed: organizations that budget for agent deployment using only visible inference or subscription cost, without accounting for the build, oversight, and failure-recovery costs described in Section 4, systematically overestimate the return on their first agent deployment. Because early deployments typically achieve only around 50 percent autonomous resolution, the effective cost per successful outcome in a new deployment's first months is meaningfully higher than the headline cost-per-task figure most vendor case studies lead with. Revenue leaders budgeting a first agent deployment should model cost using the lower, early-stage resolution rate, not the higher, mature-system resolution rate that most published ROI figures assume, since the gap between these two assumptions is large enough to change whether a deployment appears profitable in its first two quarters.
Why the taxonomy in Figure 1 should replace vendor category names in measurement dashboards
A final pattern worth naming explicitly follows directly from the functional taxonomy introduced in Section 3. Because the same underlying agent function is frequently marketed under different vendor-specific names, GTM organizations that build internal performance dashboards around vendor product names rather than functional categories make it structurally harder to compare a lead enrichment agent from one vendor against a data validation agent from another, even when the two are functionally interchangeable. Elevate's synthesis recommends that revenue operations teams building agent performance reporting adopt a functional taxonomy similar to Figure 1 as the organizing structure for that reporting, reserving vendor product names for procurement and contract tracking specifically, so that performance comparisons remain valid even as the underlying vendor landscape continues to consolidate along the lines described in Asset 4 of this series.
7. Strategic Recommendations
Elevate recommends five actions for revenue leaders planning AI agent deployment through 2027. These are sequenced deliberately, since the order in which they are applied affects whether a first deployment succeeds enough to justify the expansion the later recommendations depend on.
1. Start with a narrow, currently unworked motion, not a broad role replacement
Consistent with the Elevate Perspective in Section 6, the highest-probability first deployment is a specific, bounded motion that is currently under-resourced or entirely unworked, such as closed-lost win-back or long-tail account research, rather than an attempt to replace an entire function's full scope of work in a single deployment.
2. Budget using early-stage resolution rates, not mature-system benchmarks
Given that early agent deployments typically achieve only around 50 percent autonomous resolution against a mature-system benchmark of 70 to 80 percent, revenue leaders should model first-deployment ROI using the lower resolution rate and treat improvement toward the higher rate as a realized upside, not a starting assumption.
3. Build multi-agent orchestration rather than a single generalist agent
With field evidence showing outbound opportunity rates doubling or tripling when organizations move from single-agent to coordinated multi-agent systems, revenue leaders should plan agent deployments as a coordinated system of narrow, specialized agents with defined handoffs, consistent with the vertical agent specialization trend identified in Asset 2 of this series.
4. Fund governance and evaluation infrastructure at the rate the market is heading toward, not the rate it sits at today
With evaluation and governance spend projected to grow from roughly 18 to 24 percent of total agent program budget to 28 to 34 percent by mid-2027, revenue leaders building a multi-year agent program budget should plan for this trajectory now rather than budgeting at today's lower governance spend ratio and facing a disruptive step-function budget increase later.
5. Favor vendor-deployed agents over internal builds unless deep AI engineering capability already exists
With vendor-deployed agents reaching positive return on investment 2.4 times faster than internally built equivalents in Bain's benchmark research, revenue organizations without dedicated AI engineering capability should default to vendor-deployed agents for initial deployments, reserving internal build investment for use cases genuinely differentiated enough to justify the slower payback timeline.
ELEVATE PERSPECTIVE The organizations most likely to see the ROI compounding pattern described in Section 4 play out in their own results are the ones that treat their first agent deployment as a deliberately scoped pilot with honest cost accounting, not a broad bet sized to headline vendor cost-per-task figures. A narrow deployment that honestly clears its own return threshold earns the organizational trust needed to expand scope; a broad deployment that quietly underperforms its marketed ROI erodes that trust before the compounding gains described in this report have a chance to materialize.
8. Executive Takeaways
- "AI agent" means a taxonomy, not a single tool: Production revenue organizations deploy narrow, task-specific agents, prospecting, enrichment, meeting prep, coaching, forecasting, and support, rather than one general-purpose assistant.
- The ambition-execution gap is the widest Gartner tracks: Only 17 percent of organizations have deployed AI agents today, while more than 60 percent plan to within two years, the most aggressive adoption curve among any emerging technology Gartner measures.
- Cost advantages vary enormously by task type: AI agents show roughly 9x cost advantages on contained customer service resolution and up to 66x on routine code review, but the advantage narrows sharply on judgment-heavy work requiring mandatory human review.
- Real cost is inference cost divided by success rate, not inference cost alone: Early deployments achieving only 50 percent autonomous resolution have meaningfully higher effective cost per successful outcome than mature-system benchmarks suggest.
- ROI compounds over multiple years: Returns average 41 percent in year one, 87 percent in year two, and exceed 124 percent by year three, rewarding organizations that stay the course past an unremarkable first year.
- Multi-agent orchestration outperforms single-agent deployment: Field evidence shows outbound opportunity rates doubling or tripling when organizations move from single generalist tools to coordinated, specialized multi-agent systems.
9. Future Outlook
Based on the agent-level data synthesized in this report, Elevate expects three specific developments to define how AI agents operate inside revenue organizations between now and 2028.
First, the gap between agent deployment ambition and execution identified in Section 3 is likely to narrow primarily through failure and consolidation rather than universal success. Given that more than 40 percent of agentic AI projects are already forecast to be at risk of cancellation, as established in Asset 1 of this series, the most probable path to the 60 percent two-year deployment figure Gartner reports is not that every currently planning organization succeeds, but that successful deployment patterns, narrow scope, multi-agent orchestration, honest cost accounting, become standardized and replicable across the market as failed broader attempts are abandoned.
Second, the fully loaded cost model this report advocates for is likely to become standard practice, not a niche methodological preference, as more organizations complete a full deployment cycle and discover the gap between headline vendor cost-per-task figures and actual realized cost per successful outcome. This will likely produce a period of more conservative, more credible ROI reporting industry-wide, correcting for the overstated returns that characterized earlier agent marketing claims.
Third, the org design pattern illustrated in Section 6, a small number of humans supervising a larger number of narrow agents, is likely to move from an early-adopter case study to a standard organizational design template for at least the prospecting and top-of-funnel portion of most B2B revenue organizations, with the pace of adoption elsewhere in the funnel following the automation exposure gradient identified in Asset 2 of this series.
Fourth, voice and multimodal agent capability, currently the least mature capability frontier identified in this report, is likely to become the next major expansion point for agent taxonomy once text and data-based agents reach the standardization point described above. Revenue organizations that have already built the multi-agent orchestration discipline recommended throughout this report will be better positioned to extend that discipline to voice and multimodal agents as the capability matures, rather than starting the orchestration learning curve over for a new agent modality.
The organizations most likely to benefit from the trends described in this report are the ones treating agent deployment as an ongoing operating discipline, narrow scope, honest cost accounting, multi-agent orchestration, and proactive governance investment, rather than a single large purchase decision. Subsequent assets in this series turn from the AI and GTM foundation established across these first five assets toward GTM strategy, planning, and execution benchmarks specifically.
10. References
- Gartner. 2026 Hype Cycle for Agentic AI and 2026 CIO and Technology Executive Survey. Gartner Research, 2026.
- Forrester. Total Economic Impact studies on AI agent cost per task across customer service and engineering use cases. Forrester Research, 2026.
- McKinsey and Company. Global AI Survey 2026 and Slack Workforce Index Q1 2026, agent productivity and hours-saved data. McKinsey and Company, 2026.
- Bain and Company. Agentic AI Benchmark 2026, payback period and vendor-deployed versus internally built agent ROI research. Bain Insights, 2026.
- Outreach. Field reporting on production AI agent deployments in revenue organizations, including the SolarWinds win-back campaign example. Outreach Unleash event proceedings, 2026.
- Grand View Research. Global AI agents market sizing and growth forecast, 2025 to 2030. Grand View Research, 2026.
- Industry research on AI agent production economics, including autonomous resolution rates, failure and retry cost dynamics, and cost-per-successful-outcome methodology. Codebridge and related industry sources, 2026.
- Fin.ai. ROI of AI customer service benchmarks, including cost-per-conversation and multi-year ROI compounding data. Fin.ai Research, 2026.
- Landbase, Artemis GTM, and Lyzr. Field reporting and case data on multi-agent AI SDR systems and org restructuring examples. Industry publications, 2026.
- Elevate Research. Agent Taxonomy Across the Revenue Funnel and fully loaded cost framework, proprietary synthesis derived from Elevate's pattern intelligence analysis of the sources cited above. Elevate Research, 2026.
Contents
Related Research
GTM Research
Explore research, benchmarks, technology landscapes, and perspectives on the evolution of go-to-market.
View Research Library →