
GTM Strategy Benchmark Report
How B2B organizations actually build, own, and execute go-to-market strategy in 2026, benchmarked against planning cycle length, ownership discipline, and the strategy-execution gap that separates growth leaders from the rest.
Published 2026-08-01
1. Executive Summary
This asset opens the Strategy cluster of Elevate's research series, shifting focus from the AI and GTM technology foundation established across the first five assets to how B2B organizations actually build go-to-market strategy itself. The central finding is uncomfortable but well corroborated across independent sources: most organizations do not have a strategy execution problem so much as a strategy definition and ownership problem, and the second failure makes the first inevitable.
A 2026 survey of 511 B2B professionals across sales, marketing, product, and customer success functions found that only 37 percent of respondents define go-to-market as an integrated, cross-functional revenue framework, while roughly 21 percent of organizations either lack a formal GTM strategy entirely or have no clearly defined ownership structure for the one they have. Separately, 59 percent of B2B teams rate their own GTM process maturity and effectiveness at 6 or below on a 10-point scale, a self-assessment that is itself telling given respondents have every incentive to rate their own function favorably.
The pattern extends well beyond GTM specifically into strategy execution more broadly. Research from BCG and McKinsey consistently finds that 70 percent of digital transformation initiatives fail to meet their stated objectives, while Bain's analysis puts the figure for broader business transformations at 88 percent falling short of original ambition. Independent research analyzing more than 20,000 real strategic plans finds the mechanical root cause: 74 percent of goals, 71 percent of measures, and 57 percent of projects in a typical strategic plan have no clearly accountable owner. A strategy without an owner is not a strategy in any operationally meaningful sense, regardless of how well it is documented.
This asset benchmarks GTM strategy practice across five dimensions, planning cycle length, definitional clarity, cross-functional alignment, ownership discipline, and measurement cadence, and translates the resulting gaps into a specific set of recommendations for revenue leaders building or refreshing GTM strategy for 2027.
The sections that follow build this benchmark in stages. Section 3 establishes the current landscape of GTM strategy definition, ownership, and planning cycle practice. Section 4 details six trends explaining why the gap between GTM ambition and GTM execution persists. Section 5 compares how McKinsey, Bain, BCG, and ClearPoint Strategy each explain the mechanics of strategy execution failure. Section 6 presents Elevate's own synthesis, connecting the definitional and ownership gaps into a single causal chain. Sections 7 through 9 translate that analysis into recommendations, executive takeaways, and a forward view of how GTM strategy discipline is likely to evolve alongside the AI-native capability examined earlier in this series.
2. Research Methodology
This asset follows the same Elevate research asset formula used throughout this series: analyst research, public data, proprietary analysis, and Elevate perspective, applied consistently for comparability across all 30 assets.
Sources synthesized
This report draws on the 2026 State of B2B Go-to-Market Strategy report based on a February 2026 survey of 511 B2B professionals, The Starr Conspiracy's GTM Strategy Benchmarks analyzing planning cycle and launch performance data, SiriusDecisions research on post-launch revenue target achievement across 847 tech companies, ClearPoint Strategy's analysis of more than 20,000 real strategic plans, Bain's annual B2B Growth Agenda and CEO Agenda surveys, BCG and McKinsey research on digital transformation success rates, Deloitte Human Capital Trends research on cross-functional alignment and turnover, and Forrester research on revenue operations maturity and growth correlation.
How Elevate adds value
Strategy benchmark research is unusually prone to survivorship and self-report bias, since the organizations most willing to participate in a strategy maturity survey are frequently the ones already investing in strategy discipline, and self-rated maturity scores are subject to the same optimism bias that affects most self-assessment. Elevate's research platform uses a large language model, OpenAI's models, as its reasoning and synthesis engine, paired with a pattern intelligence layer built to weight self-reported maturity claims against harder, outcome-based evidence, such as actual revenue target achievement rates and ownership data drawn from real strategic plans rather than survey self-report, wherever both are available for the same underlying question.
Where this report presents a benchmark figure, it favors outcome-based data over self-reported sentiment where the two are available side by side, and it flags clearly where a figure reflects self-report alone. Every Elevate Perspective in this report is built from a pattern that recurs across multiple independently produced sources, not from a single survey's framing.
3. Current Market Landscape
GTM strategy in 2026 sits at an unusual inflection point: the practice is maturing conceptually faster than it is maturing operationally. The 2026 State of B2B GTM Strategy report frames this directly, describing GTM as evolving from an activity-driven, marketing-owned function into what respondents increasingly recognize should be an enterprise discipline, even though most organizations have not yet restructured ownership and process to match that recognition.
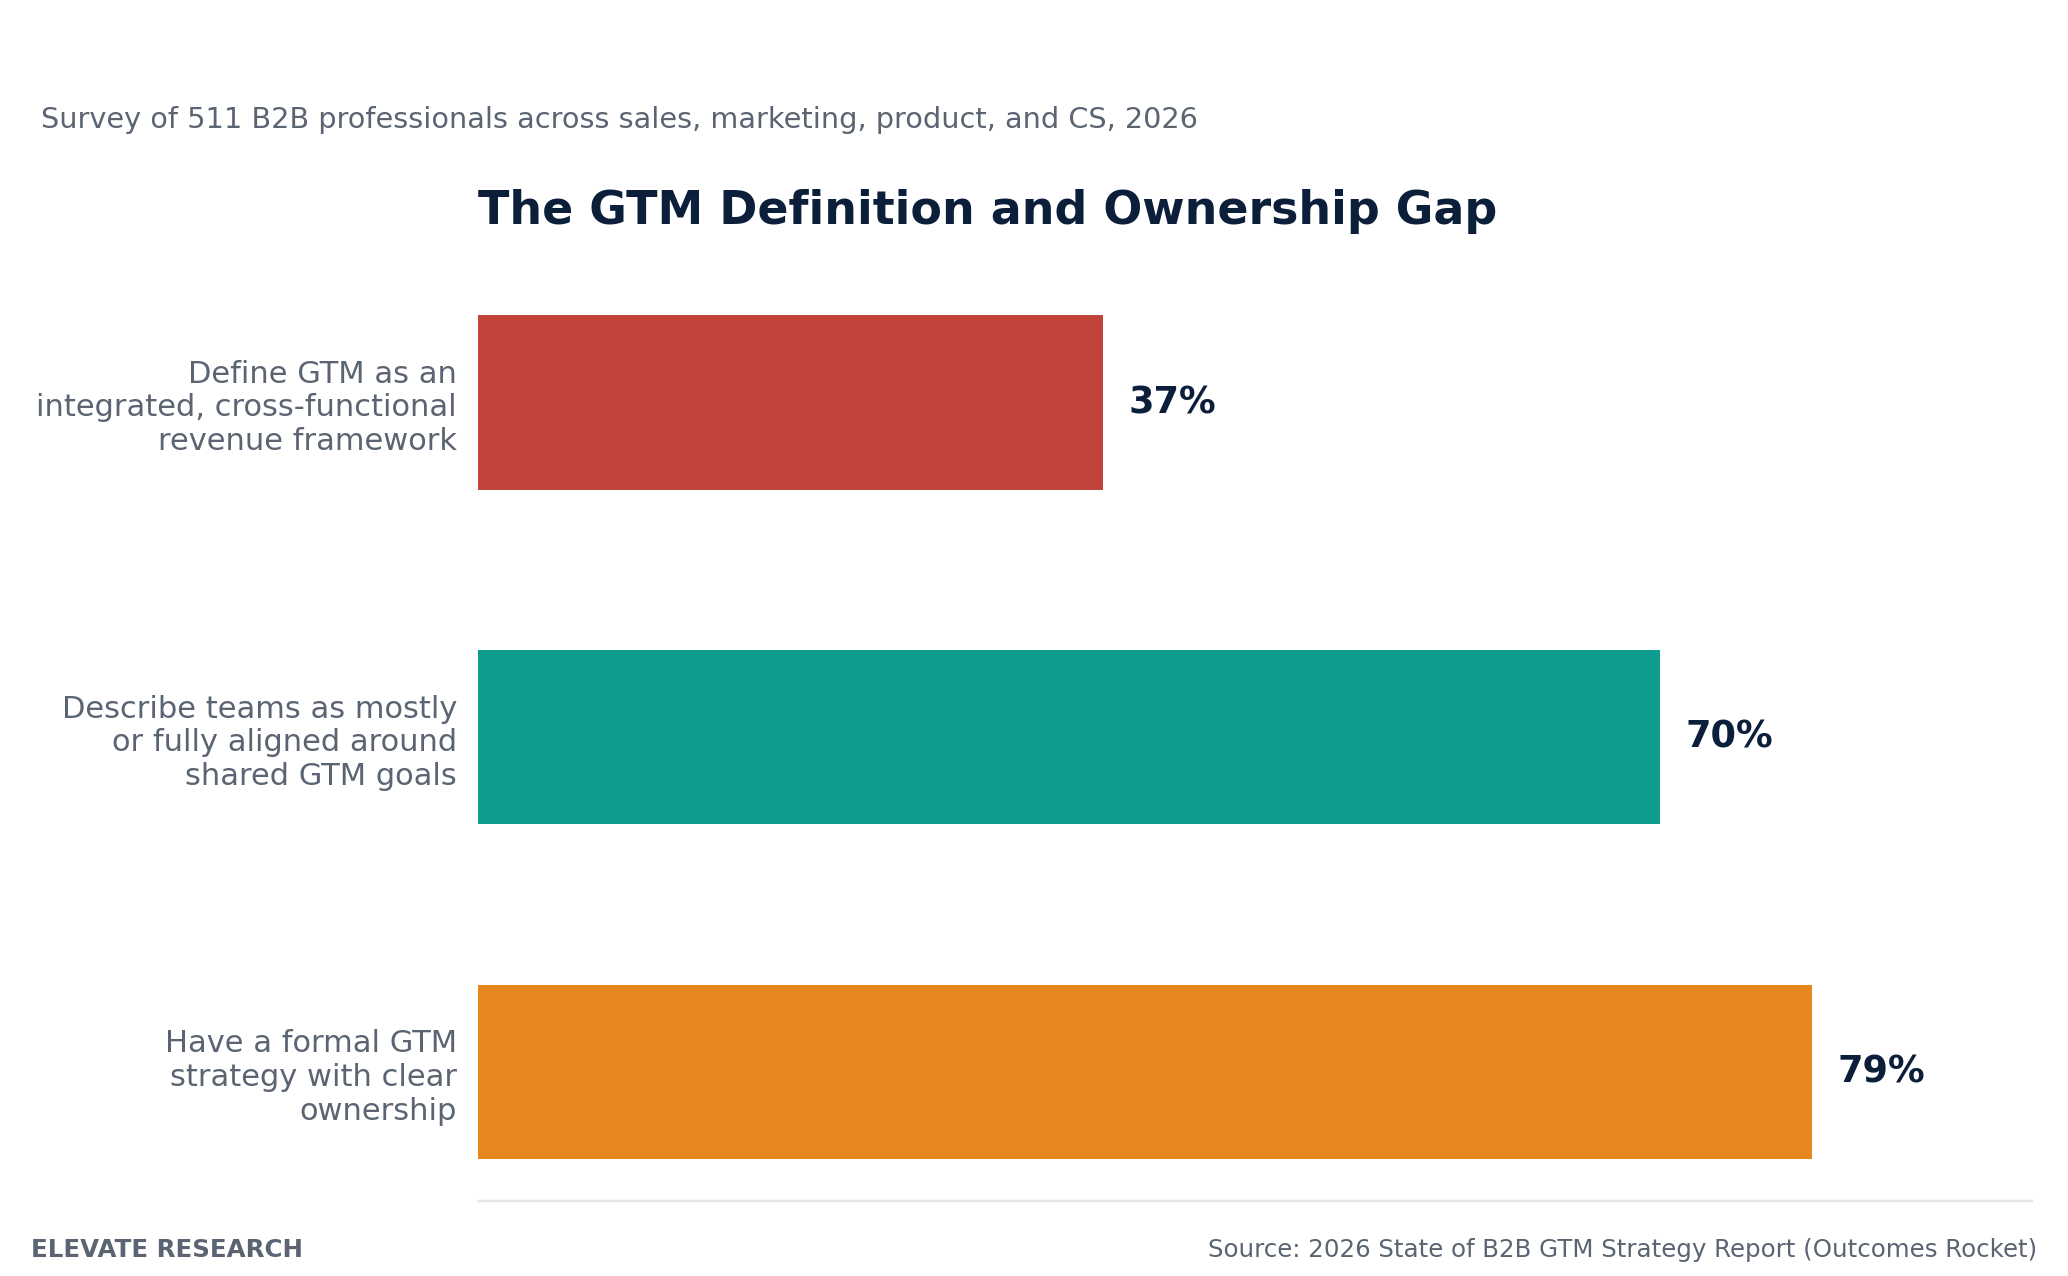 Figure 1. Share of B2B organizations reporting integrated GTM definition, cross-functional alignment, and formal strategy ownership.
The gap between conceptual maturity and operational reality shows up clearly in self-assessment data. PMA and Ignition's State of Go-to-Market Report finds that 59 percent of companies rate their own GTM process maturity and effectiveness at 6 or below on a 10-point scale, a striking figure given the well-documented tendency of self-assessment to skew favorable. Read alongside the definitional gap in Figure 1, above, the picture is consistent: most organizations know their GTM practice is underdeveloped, and a meaningful share cannot yet articulate what a mature GTM practice would even look like for their own organization.
37% of B2B professionals define go-to-market as an integrated, cross-functional revenue framework; roughly 21 percent of organizations lack a formal GTM strategy or clear ownership entirely. Source: 2026 State of B2B GTM Strategy Report, survey of 511 professionals
Planning cycle length adds a further dimension to the current landscape. The Starr Conspiracy's benchmark research finds that average GTM planning cycles run 4.2 months for B2B tech companies overall, ranging from 3.1 months at seed stage to 5.8 months at Series C and later, with companies whose planning cycles extend beyond 6 months showing 14 percent lower revenue achievement than faster-cycling peers. This is a meaningful data point for the strategy execution question this report examines throughout: planning cycle length is not simply a function of company size or complexity, it carries a measurable performance cost once it extends past a specific threshold.
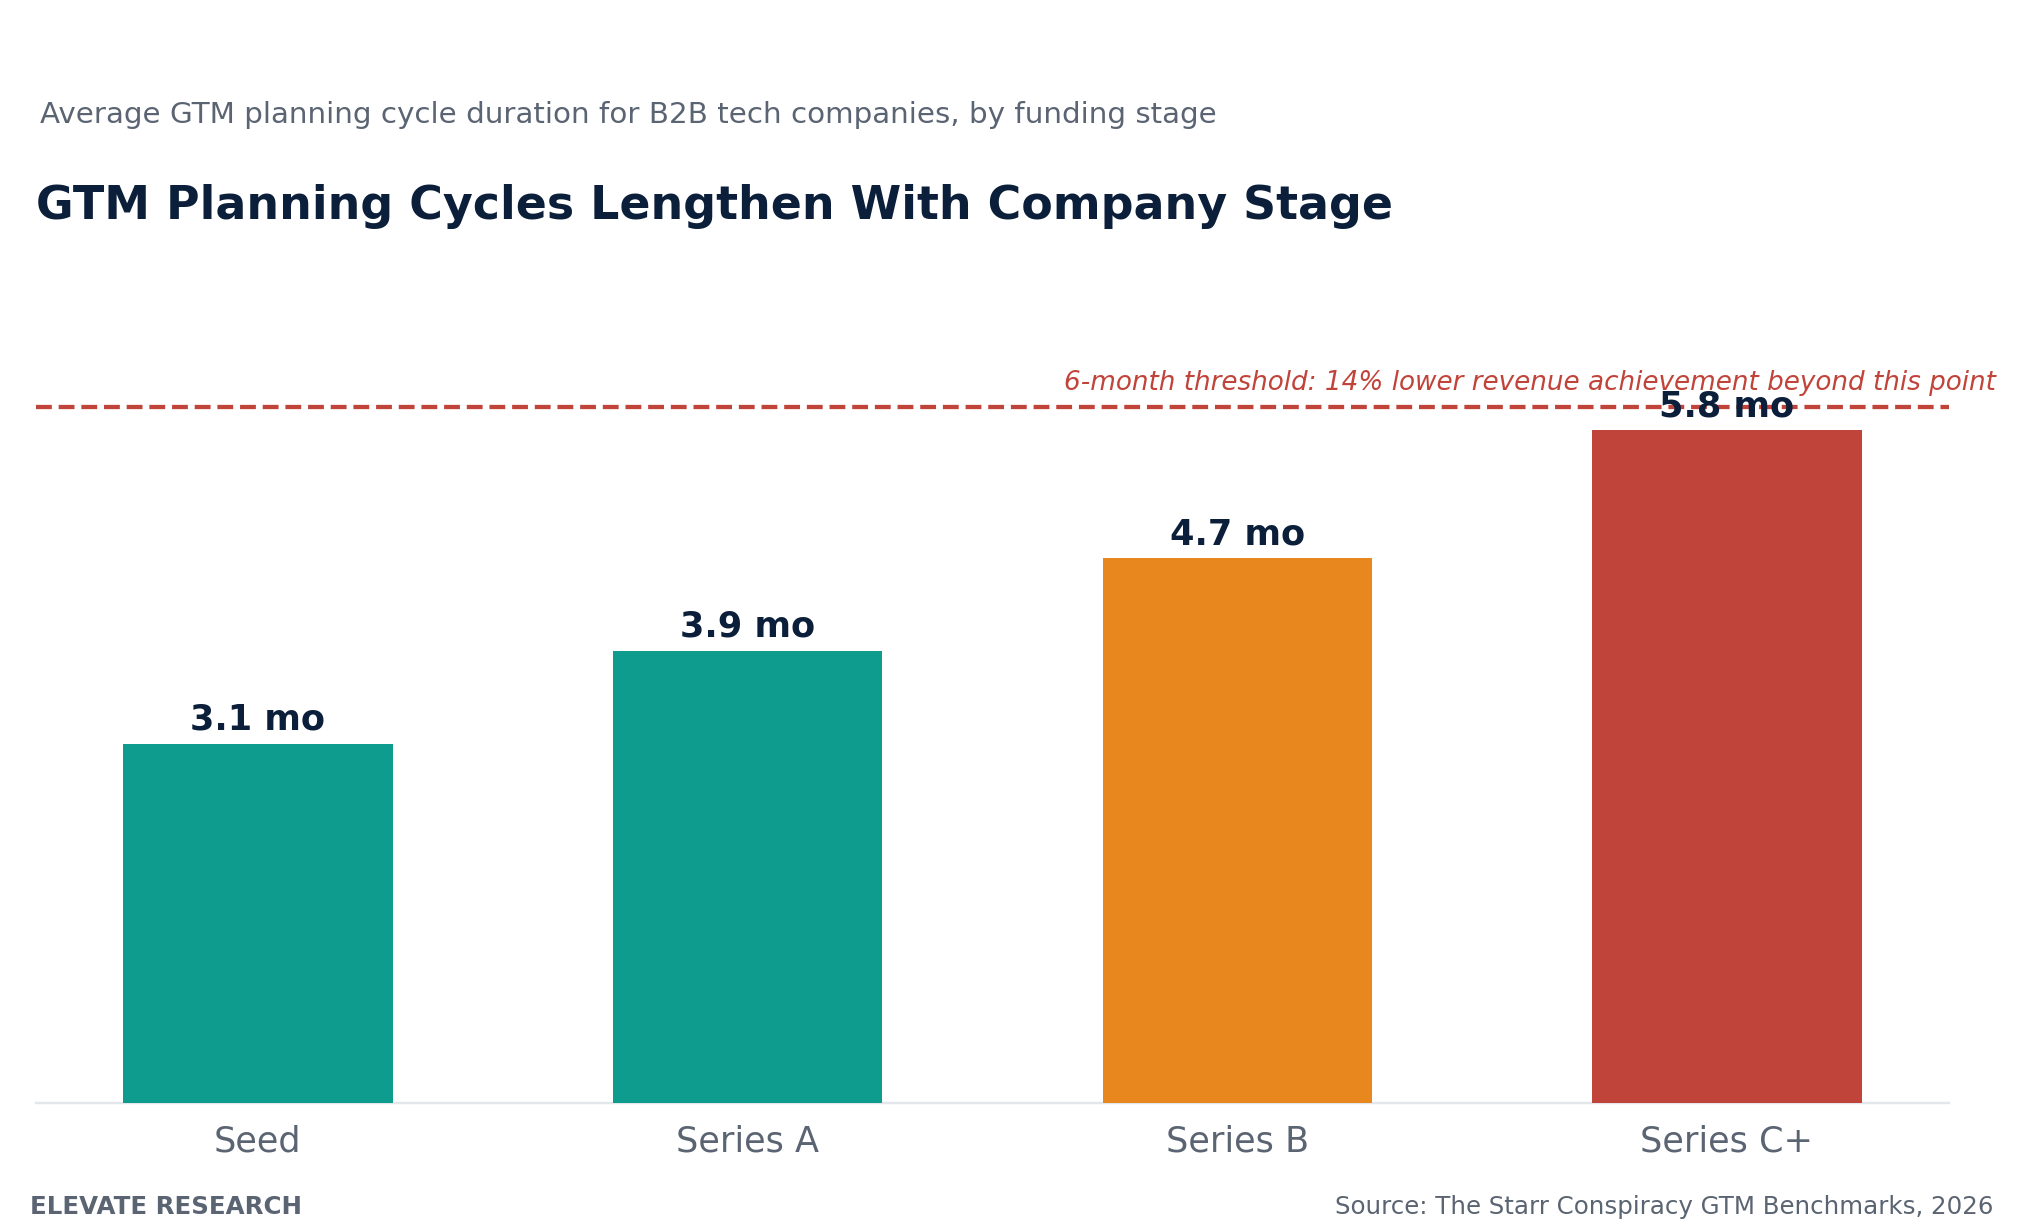 Figure 2. Average GTM planning cycle duration for B2B tech companies, by funding stage, with the 6-month performance threshold marked.
Outcome data reinforces why this planning discipline matters. SiriusDecisions' analysis of 847 tech companies found that only 23 percent of B2B companies achieve their first-year revenue targets after a product launch, while only 31 percent track leading indicators during the GTM launch phase itself, meaning most organizations that miss their launch target find out well after the point where course correction would have been possible. Separately, 89 percent of successful GTM launches, defined as those meeting or exceeding target, include a formal win and loss analysis program, a discipline that is straightforward to implement and strongly correlated with, though not proven to directly cause, better outcomes.
Company stage and market focus also shape strategy outcomes in ways worth noting for benchmarking purposes. Benchmark data comparing vertical-market and horizontal-market B2B SaaS companies finds vertical-focused companies reporting somewhat higher GTM-driven growth, 31 percent compared with 28 percent for horizontal peers, a difference plausibly linked to the definitional clarity advantage a narrower, better-understood market segment provides over a broader, more heterogeneous one. Mature revenue operations also correlate strongly with growth outcomes independent of market focus: organizations with unified data, systems, and processes across the revenue function grow three times faster than organizations with fragmented revenue operations, according to Forrester research, a finding directly consistent with the unified context layer argument introduced in Asset 1 of this series.
4. Key Trends
Six trends define how B2B organizations are approaching GTM strategy in 2026.
1. GTM is being redefined as an enterprise discipline, but ownership has not caught up
The conceptual shift from GTM as a marketing-owned activity toward GTM as a cross-functional revenue discipline is well underway in how practitioners describe their aspirations, but the ownership and process structures inside most organizations have not yet been rebuilt to match. This mirrors, at the strategy layer, the same adoption-without-maturity pattern identified at the technology layer in Asset 3 of this series: conceptual and rhetorical adoption is running well ahead of structural change.
2. Cross-functional alignment is better than definitional clarity, but still leaves meaningful execution risk
Nearly 70 percent of organizations describe themselves as mostly or fully aligned around shared GTM goals, a more encouraging figure than the 37 percent definitional clarity statistic discussed above. The remaining 30 percent, however, represents a significant execution risk specifically in the extended sales cycles and multi-stakeholder buying processes that now characterize most B2B purchasing, with buying committees averaging 6.8 decision makers per deal according to benchmark research reviewed for this report.
3. Planning cycle length carries a measurable, quantified performance cost
The 14 percent revenue achievement penalty associated with planning cycles extending beyond 6 months is one of the more directly actionable findings in this report, since planning cycle length is a process variable an organization can deliberately manage, unlike many of the softer cultural and definitional gaps described elsewhere in this report. Seed-stage companies' shorter 3.1-month average cycle is partly a function of necessity and limited resources, but the performance data suggests the discipline it forces may carry benefits beyond the resource constraint that originally produced it.
4. Ownership, not planning quality, is the most common single point of failure
ClearPoint Strategy's analysis of more than 20,000 real strategic plans finds that 74 percent of goals, 71 percent of measures, and 57 percent of projects lack a clearly accountable owner, with a further striking finding that 86 percent of nominally assigned owners are what the research terms phantom owners, individuals formally listed as accountable without the authority, resources, or attention actually required to drive the initiative forward.
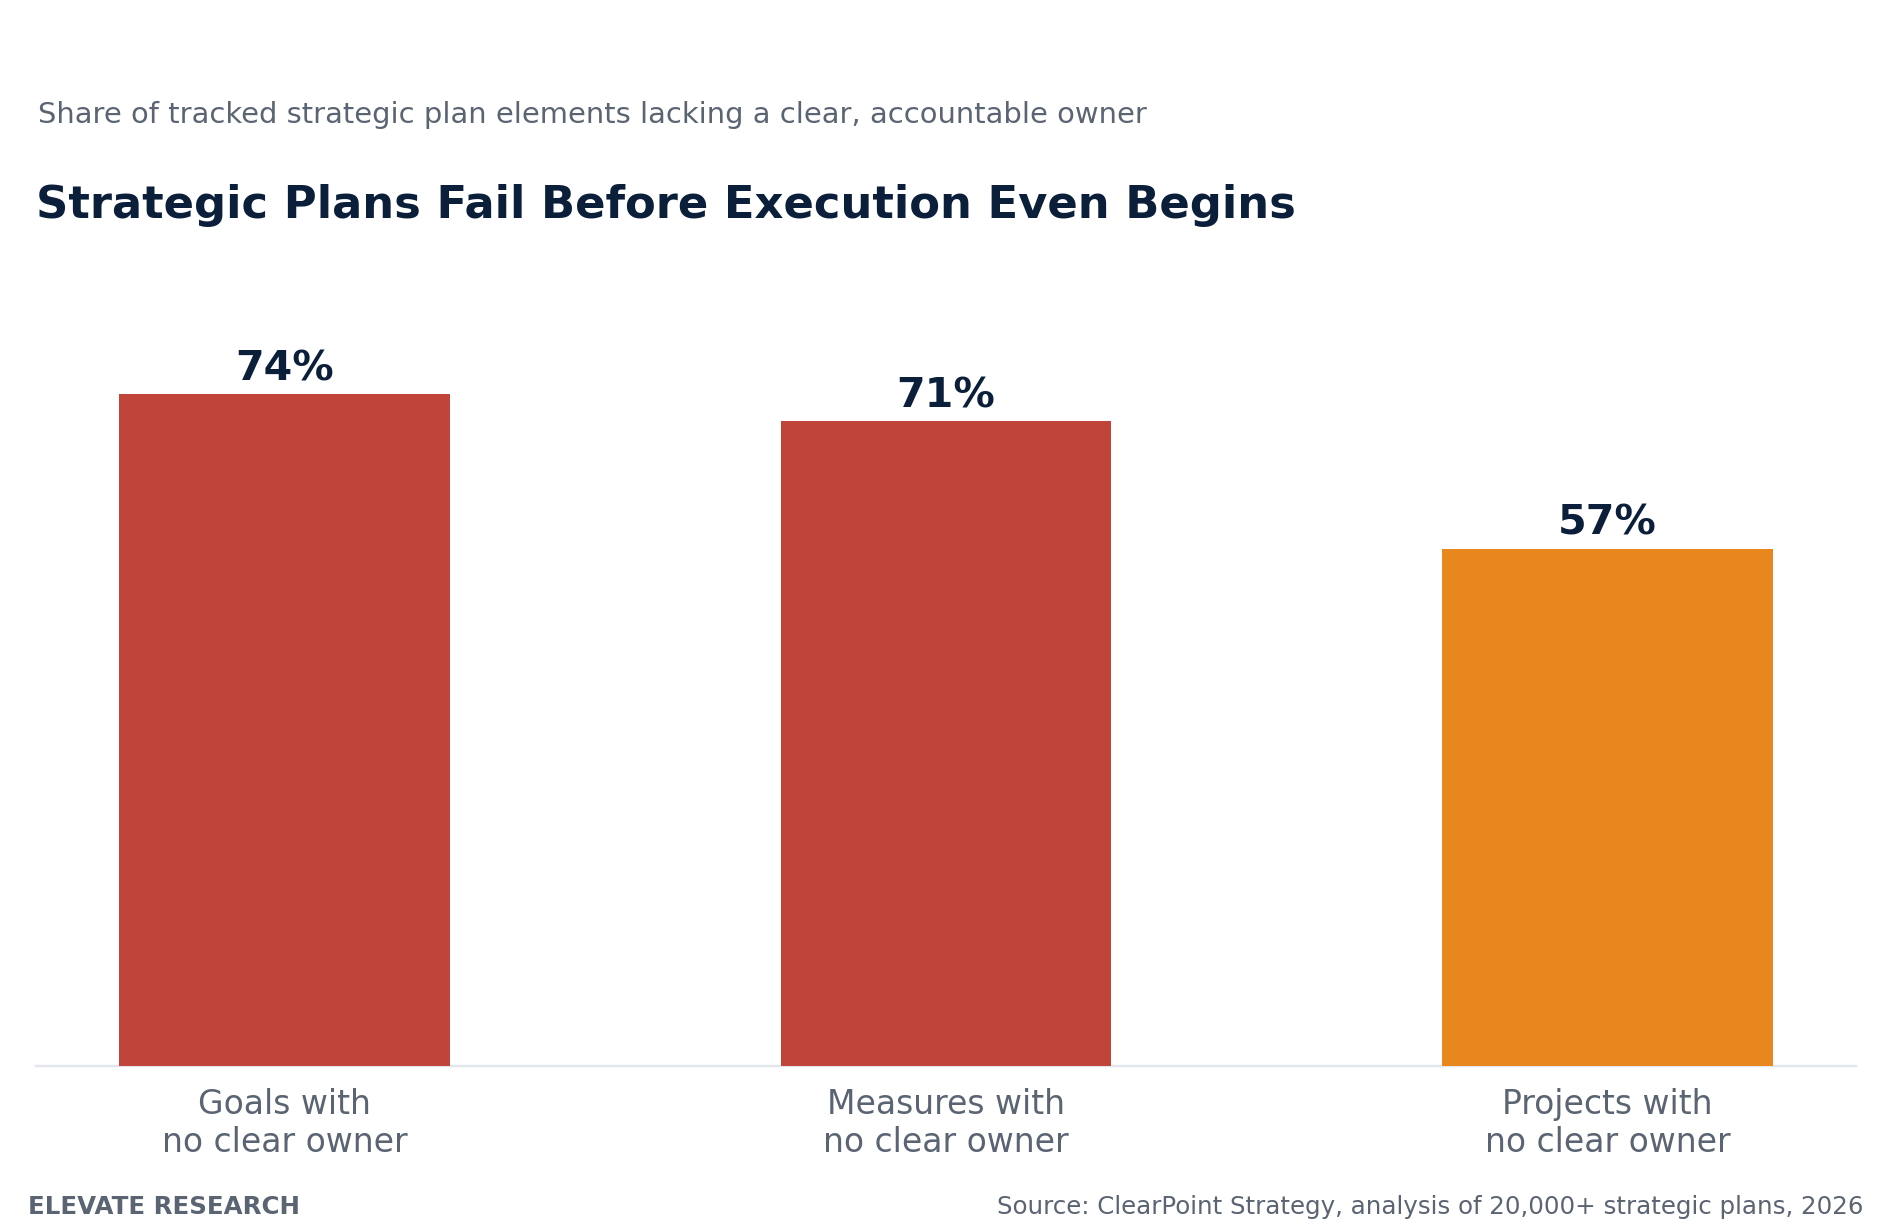 Figure 3. Share of tracked strategic plan elements lacking a clear, accountable owner, based on analysis of more than 20,000 real strategic plans.
5. Measurement cadence correlates strongly with target achievement
Benchmark research reviewed for this report finds that companies conducting weekly GTM performance reviews achieve their targets 34 percent more often than companies reviewing performance monthly, and that only 31 percent of companies track leading indicators during the GTM launch phase specifically, relying instead on lagging revenue outcomes that arrive too late to inform mid-course correction.
6. Cross-functional silos carry a direct, quantified talent cost
Deloitte's Human Capital Trends research finds that organizations with silos between sales, marketing, and customer success experience 20 percent higher staff turnover than organizations with well-aligned GTM teams, a finding that reframes cross-functional GTM alignment as a talent retention issue and not only a revenue performance issue, adding a second, independent business case for the alignment work this report recommends throughout.
7. Market focus and revenue operations maturity are independent, compounding advantages
Vertical-focused B2B SaaS companies report somewhat higher GTM-driven growth than horizontal peers, and organizations with mature, unified revenue operations grow roughly three times faster than those with fragmented revenue operations. These two advantages appear to be independent of one another rather than substitutes, meaning a vertical-focused company with fragmented revenue operations is very likely leaving compounding growth on the table that a vertical focus alone does not capture, and the reverse holds equally for a horizontally focused company with mature revenue operations discipline.
5. Analyst Perspectives
The major sources reviewed for this report converge on the shape of the strategy-execution gap while emphasizing different mechanisms behind it.
McKinsey's strategy research frames the gap in terms of impact concentration rather than universal mediocrity: plotting the economic profit of thousands of large companies produces a power curve in which the top quintile captures nearly 90 percent of all economic surplus generated, while the bottom quintile destroys a similarly large amount of value and the broad middle generates only modest returns. McKinsey's own survey of strategists found 42 percent struggling to achieve the level of impact they desired, and its research on what separates strategy champions from the rest emphasizes their ability to align leadership teams around a shared understanding of core challenges before strategy execution begins, directly consistent with the definitional clarity gap identified in this report's current landscape section.
Bain's B2B Growth Agenda and CEO Agenda research, referenced earlier in this series, contributes the clearest year-over-year evidence of the confidence-execution gap: 91 percent of commercial leaders expect to hit their 2026 growth targets, nearly identical to the 2025 figure, when 42 percent ultimately fell short. Bain's parallel CEO Agenda research frames this pattern explicitly as ambition outpacing organizational readiness to deliver it, a framing that applies with particular force to GTM strategy given the ownership and definitional gaps documented throughout this report.
BCG and McKinsey's joint finding that 70 percent of digital transformation initiatives fail to meet stated objectives, and Bain's separate finding that 88 percent of broader business transformations fall short of original ambition, together establish that the strategy-execution gap identified in this report is not specific to GTM. It is a general pattern across corporate strategy execution, of which GTM strategy execution is simply one visible, revenue-relevant instance. This has an important implication for how GTM leaders should read their own function's execution gap: it is unlikely to be solved by GTM-specific tooling or process alone, since the same gap recurs across functions with entirely different tooling and process environments.
ClearPoint Strategy's ownership research, drawn from actual strategic plan data rather than survey self-report, provides the closest available evidence for a specific mechanism behind the broader transformation failure rates the other firms document at a higher level of abstraction. Where McKinsey, Bain, and BCG describe the scale of the problem, ClearPoint's data describes a plausible proximate cause, and the two bodies of research are consistent enough with one another that reading them together produces a more complete picture than either provides alone.
6. Elevate Analysis
The individual benchmark figures reviewed above describe symptoms: low self-rated maturity, wide definitional gaps, high ownership failure rates. Elevate's synthesis focuses on the mechanism that connects them, and on what actually distinguishes the organizations that avoid this pattern from the much larger group that does not.
The market trend: strategy failure is a structural problem, not a talent or effort problem
Reading the ownership data from ClearPoint alongside the transformation failure data from BCG, McKinsey, and Bain surfaces a pattern that reframes how this report's findings should be interpreted. A 74 percent goal-ownership failure rate and a 70 to 88 percent transformation failure rate are not independent statistics describing unrelated phenomena; they are very likely describing the same underlying mechanism measured at two different points in the same causal chain. A goal without a real, resourced owner is structurally unlikely to survive contact with competing organizational priorities, regardless of how much individual talent or effort sits inside the organization pursuing it.
ELEVATE PERSPECTIVE This reframes the GTM strategy planning conversation away from a familiar but less useful question, "is our strategy good," and toward a more diagnostic and more actionable one: "does every element of our strategy have a real owner with the authority and resourcing to be accountable for it." The data in this report suggests the second question predicts execution success far better than the first, and it is also the question most strategic planning processes spend the least deliberate time answering, typically treating ownership assignment as an administrative afterthought to the strategy document itself rather than as a first-class design decision made alongside the strategy.
Why the definitional gap and the ownership gap are the same gap, viewed at different altitudes
Elevate's pattern intelligence synthesis of the definitional clarity data in Section 3 and the ownership data in Section 4 finds these two gaps are structurally linked rather than coincidentally correlated. An organization where only 37 percent of respondents share a common definition of what GTM even means cannot, by construction, cleanly assign cross-functional ownership for GTM outcomes, because ownership assignment requires a shared, specific understanding of what is being owned. The definitional gap identified at the top of this report's funnel of findings is very likely the root cause sitting upstream of the ownership gap that ClearPoint's research quantifies at the level of individual plan elements.
Why planning cadence and measurement cadence are a single discipline, not two separate initiatives
Elevate's synthesis of the planning cycle length data and the weekly-versus-monthly review cadence data in this report finds these are best understood as one operating discipline rather than two unrelated best practices. Organizations with shorter, more disciplined planning cycles and organizations with more frequent performance review cadence are very likely, though the underlying survey data does not allow this to be confirmed with certainty, the same organizations, since both behaviors reflect a shared underlying commitment to tight feedback loops over comprehensive, infrequent planning cycles. GTM leaders evaluating their own planning process should treat planning cycle compression and review cadence acceleration as a single initiative rather than two separate process improvements competing for the same limited organizational change capacity.
Why vertical focus and revenue operations maturity should be pursued together, not sequenced
Elevate's pattern intelligence synthesis of the market focus and revenue operations maturity data in Section 4 finds these two advantages compound rather than substitute for one another, a pattern easy to miss when each is examined through a single source in isolation. Organizations planning a 2027 GTM strategy refresh sometimes frame vertical focus and revenue operations investment as competing priorities for limited planning attention, choosing to sequence one before the other. The data in this report suggests this sequencing choice leaves value on the table: a vertical-focused go to market motion generates its full growth advantage only when the underlying revenue operations infrastructure is mature enough to fully exploit the narrower, better-understood market segment vertical focus provides.
7. Strategic Recommendations
Elevate recommends five actions for GTM leaders using this asset's benchmark data to strengthen strategy execution discipline through 2027.
1. Establish a single, shared definition of GTM before writing the next strategy document
Given that only 37 percent of organizations currently share a common definition of GTM as an integrated, cross-functional framework, the highest-leverage first step for any GTM strategy refresh is not more analysis, but a deliberate, cross-functional exercise to establish and document a shared definition, ideally before the next planning cycle begins rather than as an artifact produced alongside it.
2. Assign a real owner, not a phantom owner, to every strategic goal and measure
With 74 percent of goals and 71 percent of measures lacking a clearly accountable owner, and 86 percent of nominal owners lacking the authority to be genuinely accountable, GTM leaders should treat ownership assignment as a first-class strategy design decision, explicitly checking that each assigned owner has the authority, resourcing, and attention required, not simply a name attached to a line item.
3. Compress planning cycles toward the 6-month threshold or below
With planning cycles beyond 6 months associated with a 14 percent revenue achievement penalty, GTM leaders whose current planning cycle exceeds this threshold should treat cycle compression as a concrete, measurable process improvement target for the next planning cycle, rather than treating cycle length as a fixed constraint imposed by company size or complexity.
4. Move to weekly performance review cadence and build leading-indicator tracking into launch plans
With weekly review cadence associated with a 34 percent higher target achievement rate, and only 31 percent of companies currently tracking leading indicators during launch, GTM leaders should treat measurement cadence and leading-indicator visibility as a paired upgrade, implemented together rather than sequentially, since lagging-indicator-only tracking at a monthly cadence is the combination most strongly associated with late discovery of an underperforming launch.
5. Treat cross-functional alignment as a talent retention initiative, not only a revenue initiative
With silos between sales, marketing, and customer success associated with 20 percent higher staff turnover, GTM leaders building the business case for alignment investment should include retention cost alongside revenue impact, since the combined business case is considerably stronger than either argument made in isolation, and turnover cost is often more immediately visible to finance leadership than a longer-cycle revenue improvement argument.
ELEVATE PERSPECTIVE The organizations most likely to close the strategy-execution gap described throughout this report are not the ones with the most sophisticated strategic planning frameworks. They are the ones willing to treat definitional clarity and real ownership assignment as prerequisites that must be resolved before a strategy document is considered complete, rather than as details to be worked out during execution.
8. Executive Takeaways
- Most organizations do not share a common definition of GTM: Only 37 percent define it as an integrated, cross-functional revenue framework; roughly 21 percent lack a formal strategy or clear ownership entirely.
- Self-rated maturity is low despite self-report optimism bias: 59 percent of B2B teams rate their own GTM process maturity at 6 or below on a 10-point scale.
- Ownership, not strategy quality, is the most common point of failure: 74 percent of goals, 71 percent of measures, and 57 percent of projects in real strategic plans lack a clearly accountable owner, with 86 percent of nominal owners lacking real authority.
- Planning cycle length carries a quantified performance cost: Cycles extending beyond 6 months are associated with 14 percent lower revenue achievement than faster-cycling peers.
- Measurement cadence strongly predicts target achievement: Weekly performance reviews correlate with 34 percent higher target achievement than monthly reviews, yet only 31 percent of companies track leading indicators during launch.
- The strategy-execution gap is general, not GTM-specific: 70 to 88 percent of broader corporate transformation initiatives fail to meet their objectives across BCG, McKinsey, and Bain research, meaning GTM-specific tooling alone is unlikely to solve it.
9. Future Outlook
Based on the benchmark data synthesized in this report, Elevate expects three specific developments to define how B2B organizations approach GTM strategy between now and 2028.
First, the conceptual shift toward treating GTM as an enterprise discipline, already visible in how practitioners describe their aspirations in the 2026 survey data reviewed in this report, is likely to translate into structural ownership changes over the next 18 to 24 months, as the organizations that make this shift first begin to visibly outperform peers still treating GTM as a marketing-owned activity, creating competitive pressure for the rest of the market to follow.
Second, planning cadence and measurement cadence are likely to compress further as the AI-native GTM capability described throughout the first five assets of this series makes faster, more continuous planning cycles operationally feasible in ways that were not practical when planning relied primarily on manual analysis and periodic reporting. Organizations that pair the process discipline recommended in this report with the AI-native measurement capability examined earlier in this series are positioned to compress planning cycles well below the 6-month threshold identified as a performance inflection point in this report.
Third, ownership assignment discipline is likely to become a more explicit, tooled part of strategic planning software and process, as the phantom ownership problem identified by ClearPoint's research becomes better understood and organizations begin building specific safeguards, such as authority and resourcing checks at the point of assignment, rather than treating ownership as a simple name field attached to a goal.
The organizations most likely to close the gap between GTM ambition and GTM execution described throughout this report are the ones treating definitional clarity and real ownership as prerequisites for strategy, not artifacts of it. Subsequent assets in this series examine specific dimensions of GTM strategy execution in more depth, including GTM maturity benchmarking, planning process design, and investment allocation trends.
10. References
- Outcomes Rocket. The 2026 State of B2B Go-to-Market Strategy report, survey of 511 B2B professionals in the US and UK. February 2026.
- PMA and Ignition. State of Go-to-Market Report, GTM process maturity self-assessment data. Cited 2024 to 2026.
- The Starr Conspiracy. Go-to-Market Strategy Statistics and Benchmarks, planning cycle length and revenue achievement data. 2026.
- SiriusDecisions. Analysis of 847 tech companies on post-launch revenue target achievement and leading indicator tracking. Q3 2024, cited 2026.
- ClearPoint Strategy. 2026 Strategic Planning Report, analysis of more than 20,000 real strategic plans on goal, measure, and project ownership. 2026.
- Bain and Company. B2B Growth Agenda 2026 and The 2026 CEO Agenda, commercial leader and CEO confidence-execution gap research. Bain Insights, 2026.
- Boston Consulting Group and McKinsey and Company. Digital transformation success rate research, cited via Acuvity Consulting analysis. 2026.
- McKinsey and Company. Strategy execution research, including the economic profit power curve and Role of the Strategist survey. McKinsey Quarterly, cited 2026.
- Deloitte. Human Capital Trends research on cross-functional silos and staff turnover. Cited via BrixonGroup, 2025.
- Forrester Research. Revenue operations maturity and revenue growth correlation research. Cited via PepperInsight, 2025.
- Elevate Research. Synthesis of the definitional and ownership gap patterns across GTM strategy and broader corporate strategy execution research. Elevate Research, 2026.
Contents
Related Research
GTM Research
Explore research, benchmarks, technology landscapes, and perspectives on the evolution of go-to-market.
View Research Library →