Where Existing GTM Stacks Break Down
Most GTM stacks do not fail all at once. They fail quietly, at the same five predictable points, over and over, usually getting blamed on something else entirely. Here is an evidence-based audit of where those points actually are.
Published 2026-07-25
When a GTM motion underperforms, the explanation that surfaces first is almost never architectural. It is usually personal or organizational: a rep who did not follow up in time, a marketing and sales alignment problem, a data quality issue attributed to carelessness. These explanations are not necessarily wrong in any individual case. They are, taken as a pattern across many cases, frequently incomplete, because they treat as a one-off human failure something that is actually a structural, recurring gap in how the stack itself is built.
This piece is an audit, not a pitch. It looks specifically at where existing GTM stacks, the mix of CRM, sales engagement, enrichment, and other point tools most B2B companies run today, actually break down in practice, based on common patterns reported across RevOps and GTM operations discussions rather than any single vendor's product claims. The goal is to separate the symptom a team usually notices from the structural cause underneath it, since the two are consistently different, and only one of them actually gets fixed by adding headcount or running another alignment meeting.
This distinction between symptom and cause is the organizing idea behind everything that follows, and it is worth stating plainly up front because it changes how the rest of this piece should be read. None of the five break points described here are exotic or hard to recognize once named. Most GTM leaders reading this piece will recognize at least three or four of them immediately from their own experience. What tends to be harder is connecting a specific, recent frustration, a missed signal, a lost deal, a frustrating cross-team disagreement, back to the specific structural gap that actually produced it, rather than to whichever more visible, more personal explanation happened to be closest at hand when the post-mortem conversation took place.
Why the Same Failures Keep Recurring
Before cataloging specific break points, it helps to understand why the same handful of failures show up so consistently across otherwise different companies, industries, and team sizes.
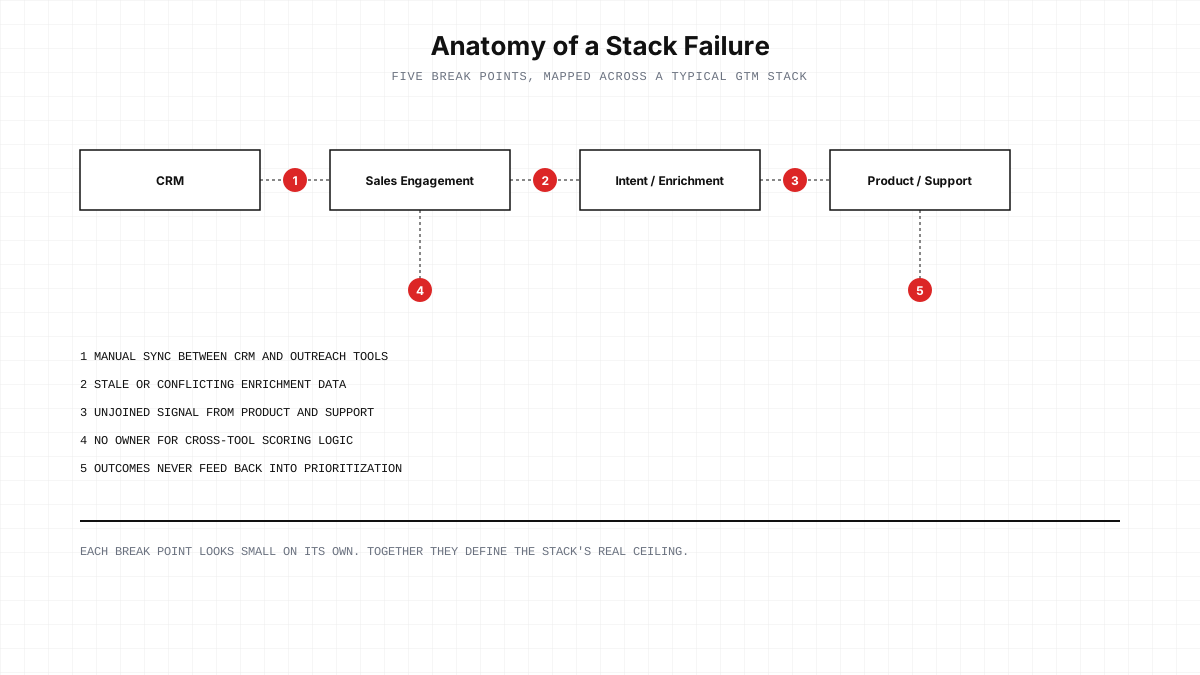
A modern GTM stack is not one system, it is a loose federation of several systems, each maintained by a different vendor, each with its own data model, release schedule, and design priorities. The seams between those systems, where data has to move from one tool's world into another's, are structurally the weakest points in the stack, because no single vendor is fully responsible for making that specific connection work well, reliably, and continuously. Each individual tool can be excellent at its own job and the seams between them can still be fragile, because excellence within a tool and reliability across the boundary between tools are different engineering problems, solved by different people, usually without much coordination between the teams responsible for each side.
This is the structural reason the same five break points recur across so many different organizations. They are not random failures specific to any one company's discipline or diligence. They are the predictable, recurring seams in a federated stack architecture, and they show up wherever that architecture is used, regardless of how skilled the team operating it happens to be.
A Familiar Pattern: Integration Debt Compounds Quietly
This specific dynamic, where a system built from many separately excellent parts accumulates failure specifically at the seams between those parts, is a well documented pattern in software engineering more broadly, and it is useful to borrow the vocabulary that discipline has already developed for it.
Software engineers use the term integration debt to describe exactly this pattern: the accumulated cost of connecting systems that were not originally designed to work together, a cost that does not show up as a single, visible failure but as a steady accumulation of small frictions, each individually easy to work around, that together slow a system down and make it progressively more fragile. Integration debt shares a defining trait with the more widely known idea of technical debt: it is nearly invisible in the moment each individual shortcut gets taken, and it becomes visible only in aggregate, once enough of it has accumulated to noticeably degrade how the overall system performs.
GTM stacks accumulate an almost identical kind of debt, for almost identical reasons. Each individual manual handoff, each individually unreconciled scoring conflict, each individually unjoined signal source, is a small, easy to justify shortcut in the moment, adopted because building a fully automated, reconciled connection between two specific tools was not the highest priority use of a RevOps team's limited engineering time that week. The debt this creates is real, but it does not announce itself as a single event. It shows up gradually, as a slowly rising baseline of missed signal, inconsistent prioritization, and manual coordination effort that quietly becomes normal, expected overhead rather than a problem anyone is actively trying to solve.
Recognizing this as debt, rather than as an unfortunate but unavoidable feature of running a modern GTM stack, is a useful reframe. Debt can be measured, prioritized, and paid down deliberately, in a way that a vague sense of stack friction usually cannot be. The five break points catalogued in this piece are, in effect, an attempt to itemize that debt specifically enough that a team can start deciding, deliberately, which parts of it are worth paying down first.
The Five Most Common Break Points
Based on common patterns reported across RevOps communities, implementation post-mortems, and GTM operations discussions, five specific break points recur far more often than any others.
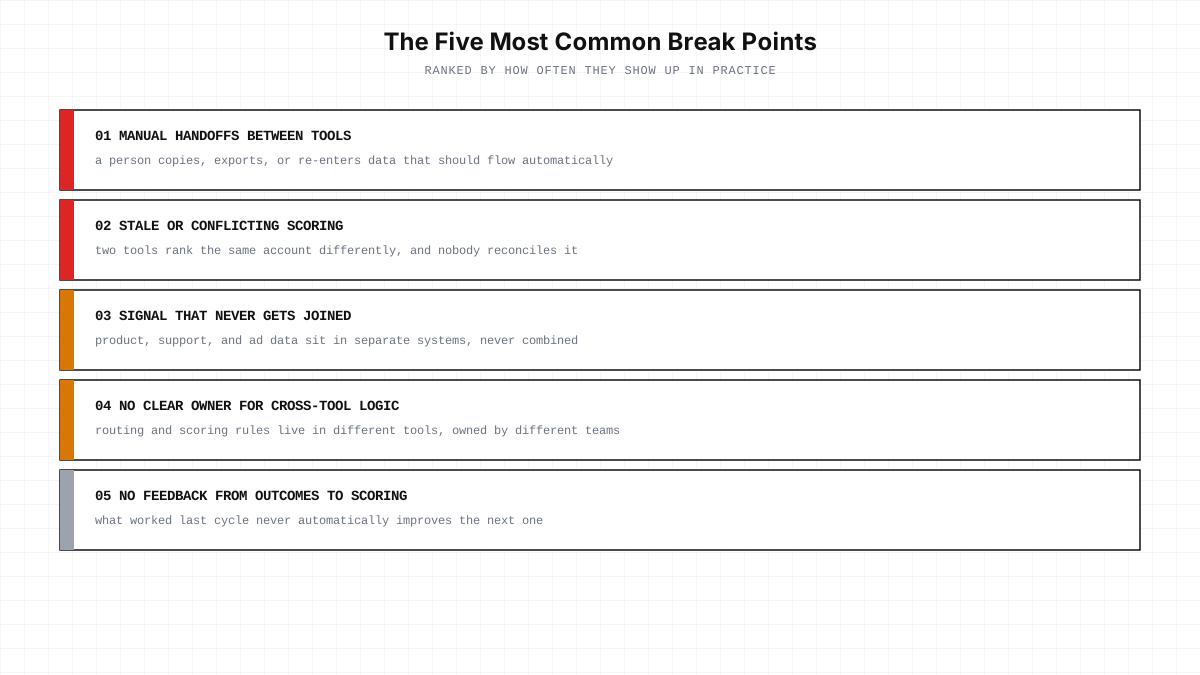
Manual handoffs between tools. This is the most frequently cited break point, and it is also the most visible once named directly: a person copying data from one tool into another, exporting a list and re-uploading it elsewhere, manually checking a second system because the first one does not automatically reflect what the second one knows. Every manual handoff is a point where delay, error, and simple human forgetting can quietly break the chain between a signal arriving and the right action happening.
Stale or conflicting scoring. Different tools in a typical stack often maintain their own, independently calculated view of which accounts matter most, a CRM's lead score, a sales engagement platform's engagement score, an enrichment tool's fit score, and these scores frequently disagree with each other, sometimes significantly, because they are built on different data, different logic, and different update schedules. When nobody owns reconciling that disagreement, reps are left to use their own judgment about which score to trust, which reintroduces exactly the kind of inconsistent, unscalable manual judgment a scoring system was supposed to replace.
Signal that never gets joined. Product usage data, support ticket context, ad engagement, and CRM activity commonly live in genuinely separate systems that were never designed to be queried together. A rep or a scoring model working from only one of these sources is working from a partial picture, and the specific signals most predictive of real buying intent, often exactly the ones spanning multiple systems, product usage combined with a specific firmographic trait combined with recent support activity, are the ones most likely to be missed entirely when the underlying data never gets joined in the first place.
No clear owner for cross-tool logic. Routing rules, scoring thresholds, and escalation criteria often end up split across several different tools, each configured by a different team, sometimes without full visibility into how the others are configured. When account behavior does not match what anyone expected, tracing the actual cause often requires investigating several different tools' independently configured logic, since no single person or team owns the full, cross-tool picture of how a decision actually gets made.
No feedback loop from outcomes back to scoring. Even when a stack tracks which plays worked and which did not, that information rarely flows automatically back into how future accounts get scored and prioritized. A pattern that a sharp analyst might notice in a quarterly review, this segment converts better through this channel, stays trapped in a report rather than automatically improving how the system prioritizes similar accounts going forward.
Symptom vs Root Cause
A large part of why these break points persist, even at otherwise well run organizations, is that the symptom they produce and the actual root cause underneath it are rarely connected in how the problem gets diagnosed.
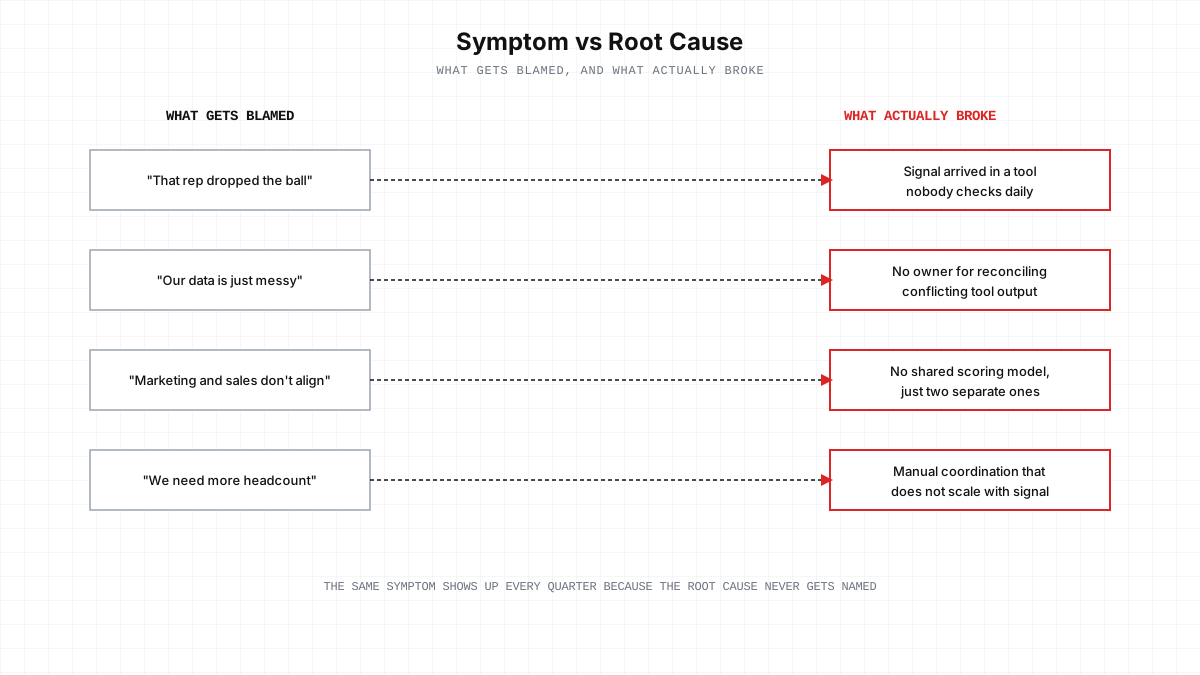
A rep who "dropped the ball" on a hot account often did so because the relevant signal arrived in a tool they do not check daily, not because of a personal lapse in diligence. Data that gets dismissed as "just messy" is frequently the result of nobody owning the reconciliation between two tools' conflicting outputs, not a general absence of data discipline. A marketing and sales alignment problem is often, underneath the interpersonal framing, two teams working from two different scoring models that were never unified into one shared source of truth. And a call for more headcount to keep up with growing signal volume is frequently a request for more people to do manual coordination work that does not scale linearly with volume in the first place, a problem more headcount can only ever partially and temporarily solve.
This misdiagnosis pattern matters because it shapes what gets fixed. A team that attributes a missed signal to a specific rep's oversight addresses it with a conversation or, at most, a process reminder. A team that correctly identifies the actual cause, signal arriving in a tool nobody systematically monitors, addresses it by closing that specific structural gap, which prevents the same failure from recurring with the next account and the next rep. The first response treats a symptom. The second treats the cause, and only the second one actually reduces how often the underlying failure repeats.
How Often Each Break Point Actually Shows Up
Grounding this in relative frequency helps prioritize where to look first.
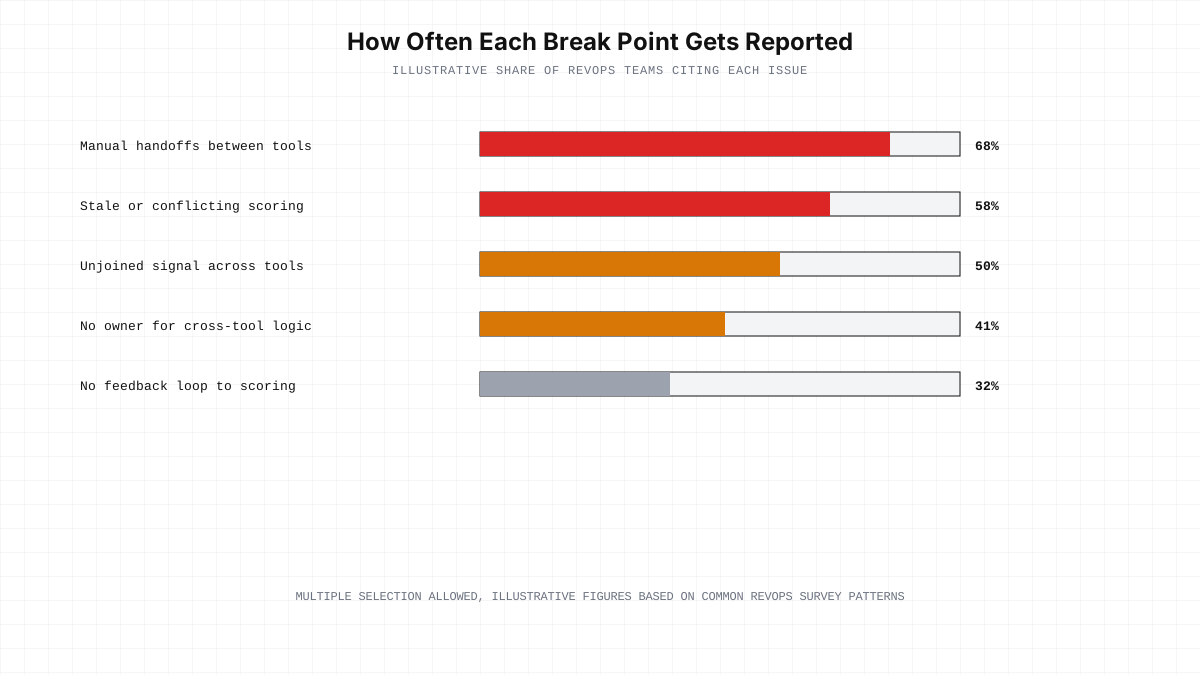
Manual handoffs between tools and inconsistent or conflicting scoring are, by a wide margin, the most commonly cited issues across RevOps discussions and implementation retrospectives, which tracks with how directly visible both problems tend to be once a team starts looking for them specifically. Unjoined signal and unclear ownership of cross-tool logic are reported somewhat less frequently, in part because they are harder to notice without deliberately auditing for them, not necessarily because they occur less often in practice. The absence of a feedback loop from outcomes back to scoring is the least frequently cited, likely because it is the least visible of the five, a missing capability rather than an active daily annoyance, which makes it easy to overlook even though its long term cost, described in more detail elsewhere in this content series, compounds steadily over time.
Which Break Points Cost the Most
Frequency alone does not tell the full story, since some break points are both common and quickly noticed, while others are rarer but considerably more expensive by the time anyone catches them.
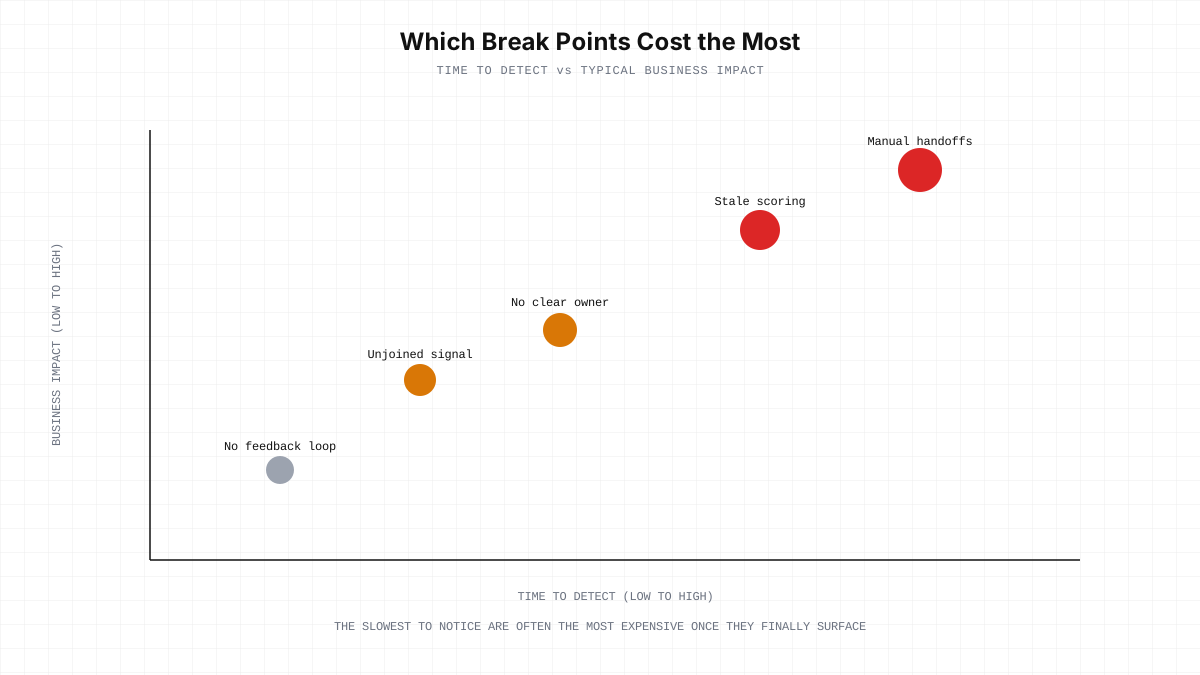
Manual handoffs and stale scoring tend to sit in the more expensive, harder to detect quadrant of this comparison, largely because their effects accumulate quietly, one missed handoff or one slightly wrong prioritization at a time, until the aggregate cost becomes large enough to notice as a clear pattern rather than an isolated incident. Unjoined signal and unclear ownership carry meaningful but somewhat lower typical impact, often because their effects are more localized to specific accounts or specific decisions rather than compounding across the entire stack. The absent feedback loop, while the least frequently reported, tends to carry a distinctly long term cost, a system that never improves its own scoring model falls progressively further behind a system that does, a gap that widens quietly over quarters rather than appearing as a single, attributable failure.
Objections and Counterarguments
"These break points are really just data quality and process discipline problems, not architectural ones." There is a real, defensible version of this argument, and good data hygiene and clear process genuinely do reduce how often these break points cause visible harm. The response is that discipline and process are mitigations, not fixes, for what remains a structural gap: even a highly disciplined team using disconnected tools still has to manually do the joining, reconciling, and feedback work a genuinely integrated system would otherwise handle automatically, and that manual effort does not scale as signal volume grows, regardless of how disciplined the team executing it happens to be.
"Bigger, more sophisticated companies with larger RevOps teams do not experience these break points as severely." This is only partially true, and it is worth being specific about why. Larger, better resourced RevOps teams are often better at mitigating these break points through more disciplined manual process and more dedicated headcount for reconciliation work, but the underlying structural gaps this piece describes do not disappear at scale, they typically compound, since a larger organization usually runs a larger, more fragmented stack with more seams between more tools. A larger team's ability to paper over these gaps with more disciplined manual effort is a real advantage, but it is a mitigation, not evidence that the underlying architectural issue was never really there.
"This framing places too much blame on the stack and not enough on genuinely poor execution, which does exist and matters." This is a fair check on the piece's own framing. Genuinely poor execution, careless data entry, inattentive follow up, weak process discipline, is real, does happen, and should not be excused by attributing every failure to architecture. The point of this piece is not that individual execution never matters, it is that a meaningful and often underestimated share of what gets attributed to individual execution failure is, on closer inspection, a structural gap that would have produced a similar outcome regardless of who was operating the stack, and distinguishing between the two matters for deciding what actually needs to change.
"Naming these break points does not tell a team how urgently or in what order to address them, which limits how actionable this is." This is a reasonable practical limitation to acknowledge directly. The relative frequency and cost data presented in this piece is illustrative and general, and the right prioritization for any specific team depends on their own stack, their own signal volume, and where their own specific losses are concentrated, which this general audit cannot substitute for. What this piece offers is a framework and a starting vocabulary for that more specific, internal audit, not a replacement for doing it.
What This Means for GTM Teams
Run this audit against your own stack specifically, not just in the abstract. For each of the five break points described here, identify a concrete, recent example from your own GTM motion. A team that cannot immediately name a recent instance of at least three of these five patterns is unusual, and the exercise itself tends to be more persuasive than any general argument about why these gaps matter.
Separate the symptom from the cause explicitly in post-mortems. When a deal is lost or a signal is missed, push the post-mortem conversation past the first, most available explanation, toward asking specifically which of the five structural break points, if any, contributed to the outcome. This does not mean individual accountability disappears, it means the conversation also captures the structural factor that will keep producing similar outcomes until it is addressed.
Prioritize based on your own frequency and cost, not a generic ranking. The relative frequency and cost patterns described in this piece are a reasonable starting point, but the right priority order for any specific team depends on where their own stack's seams actually are, and a team's own honest audit, run using the framework in this piece, will produce a more accurate and more actionable ranking than any general industry pattern.
Treat closing these gaps as an ongoing discipline, not a one-time project. As described elsewhere in this content series, a stack's seams tend to reopen as the underlying tools change, as signal volume grows, and as the organization itself evolves. A one-time integration project that closes today's version of these five break points is valuable, but it is not a permanent fix, and revisiting this audit periodically is a more durable approach than treating it as a problem to be solved once and then set aside.
Where Elevate GTM Solutions Fits
Several of the break points catalogued in this piece, stale or conflicting scoring, unclear ownership of cross-tool logic, and the absence of a feedback loop from outcomes back to strategy, trace back to the same root cause: a strategic layer that is not natively connected to the rest of the stack. Elevate GTM Solutions is built to close that specific seam.
As the AI-native GTM platform and GTM operating system built to unify GTM context and keep it connected to execution and analytics, Elevate is designed to reduce exactly the kind of integration debt this piece has described, not by replacing the other tools in a stack, but by giving the strategic and decisioning layer sitting above them a single, continuously current home, rather than leaving that layer implicit and rebuilt from memory at every quarterly review. A team applying the audit this piece recommends, tracing a recent example of each break point back to its structural cause, will frequently find that cause sits at exactly this layer, which is the layer Elevate is built to own.
Conclusion
Most GTM stacks do not fail dramatically or all at once. They fail quietly, at the same five predictable seams, repeatedly, and the failures usually get attributed to something more visible and more personal than the actual structural cause. This pattern is not a reflection of any particular team's lack of skill or diligence. It is a predictable consequence of running GTM through a federation of separately built tools, each excellent within its own boundaries and each contributing to seams between those boundaries that no single vendor is fully responsible for making work.
Recognizing this pattern does not immediately fix it, and this piece has not claimed otherwise. What it offers is a more accurate diagnosis than the explanations most teams reach for by default, and a more accurate diagnosis is usually the necessary first step toward actually closing the gap, whether that means better process discipline, targeted internal engineering effort, or a dedicated coordination layer purpose built to close these specific seams.
The integration debt framing introduced earlier in this piece is worth returning to here, since it points toward the most useful mindset for actually acting on this audit. Debt that goes unnamed tends to accumulate indefinitely, since nobody is tracking it closely enough to know when it has become worth addressing. Debt that gets itemized, as this piece has tried to do across five specific, recurring break points, becomes something a team can actually prioritize, measure, and pay down deliberately, rather than something that simply gets absorbed as normal, unavoidable friction. Teams that keep attributing these failures to individual performance or vague data quality issues will keep experiencing the same failures next quarter. Teams that trace them back to the specific, structural seam each one represents are in a position to actually close it.
Contents
Related Research
GTM Research
Explore research, benchmarks, technology landscapes, and perspectives on the evolution of go-to-market.
View Research Library →